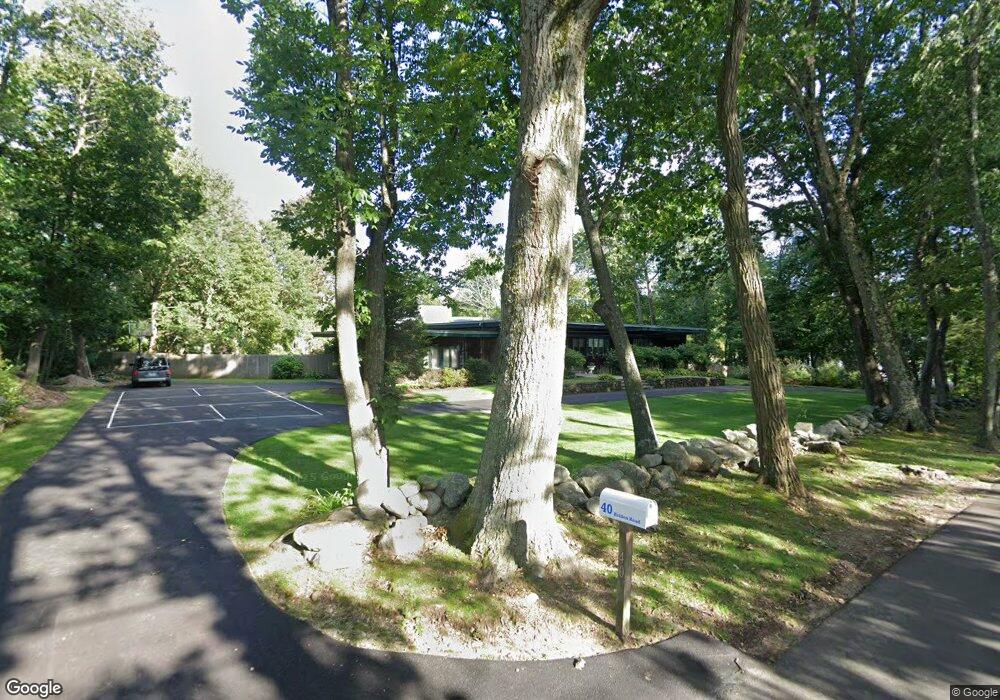
40 Hidden Rd Andover, MA 01810
Southern Andover NeighborhoodEstimated Value: $1,324,000 - $1,895,000
4
Beds
4
Baths
4,255
Sq Ft
$377/Sq Ft
Est. Value
About This Home
This home is located at 40 Hidden Rd, Andover, MA 01810 and is currently estimated at $1,602,950, approximately $376 per square foot. 40 Hidden Rd is a home located in Essex County with nearby schools including South Elementary School, Doherty Middle School, and Andover High School.
Ownership History
Date
Name
Owned For
Owner Type
Purchase Details
Closed on
Mar 23, 2018
Sold by
Troiano 2Nd Robert A and Troiano Gretchen E
Bought by
Troiano 2Nd Robert A
Current Estimated Value
Purchase Details
Closed on
Jun 20, 1997
Sold by
Berman Victor
Bought by
Troiano Ii Robert A
Home Financials for this Owner
Home Financials are based on the most recent Mortgage that was taken out on this home.
Original Mortgage
$351,000
Interest Rate
7.87%
Mortgage Type
Purchase Money Mortgage
Purchase Details
Closed on
Apr 17, 1991
Sold by
Samel Norman
Bought by
Berman Victor
Create a Home Valuation Report for This Property
The Home Valuation Report is an in-depth analysis detailing your home's value as well as a comparison with similar homes in the area
Home Values in the Area
Average Home Value in this Area
Purchase History
| Date | Buyer | Sale Price | Title Company |
|---|---|---|---|
| Troiano 2Nd Robert A | -- | -- | |
| Troiano Ii Robert A | $390,000 | -- | |
| Berman Victor | $370,000 | -- |
Source: Public Records
Mortgage History
| Date | Status | Borrower | Loan Amount |
|---|---|---|---|
| Previous Owner | Berman Victor | $440,000 | |
| Previous Owner | Berman Victor | $100,000 | |
| Previous Owner | Berman Victor | $351,000 | |
| Previous Owner | Berman Victor | $290,000 |
Source: Public Records
Tax History
| Year | Tax Paid | Tax Assessment Tax Assessment Total Assessment is a certain percentage of the fair market value that is determined by local assessors to be the total taxable value of land and additions on the property. | Land | Improvement |
|---|---|---|---|---|
| 2024 | $16,239 | $1,260,800 | $672,300 | $588,500 |
| 2023 | $15,542 | $1,137,800 | $605,600 | $532,200 |
| 2022 | $14,620 | $1,001,400 | $526,800 | $474,600 |
| 2021 | $14,001 | $915,700 | $478,900 | $436,800 |
| 2020 | $13,429 | $894,700 | $467,100 | $427,600 |
| 2019 | $13,296 | $870,700 | $453,600 | $417,100 |
| 2018 | $12,834 | $820,600 | $436,200 | $384,400 |
| 2017 | $12,282 | $809,100 | $427,500 | $381,600 |
| 2016 | $11,992 | $809,200 | $427,500 | $381,700 |
| 2015 | $11,551 | $771,600 | $410,900 | $360,700 |
Source: Public Records
Map
Nearby Homes
- 16 Porter Rd
- 4 Hammond Way
- 31 Porter Rd
- 57 Salem St
- 49 Salem St
- 52 Salem St
- 56 Sunset Rock Rd
- 344 S Main St
- 133B Salem
- 3 West Hollow
- 154 Main St
- 3 Torr St
- 23 Belknap Dr
- 100.5 Main St Unit Q
- 105 Central St
- 11 Wyncrest Cir
- 3 Regency Ridge
- 96 N Main St Unit 3
- 33 Chestnut St Unit 2
- 81 Chestnut St Unit 81
Your Personal Tour Guide
Ask me questions while you tour the home.