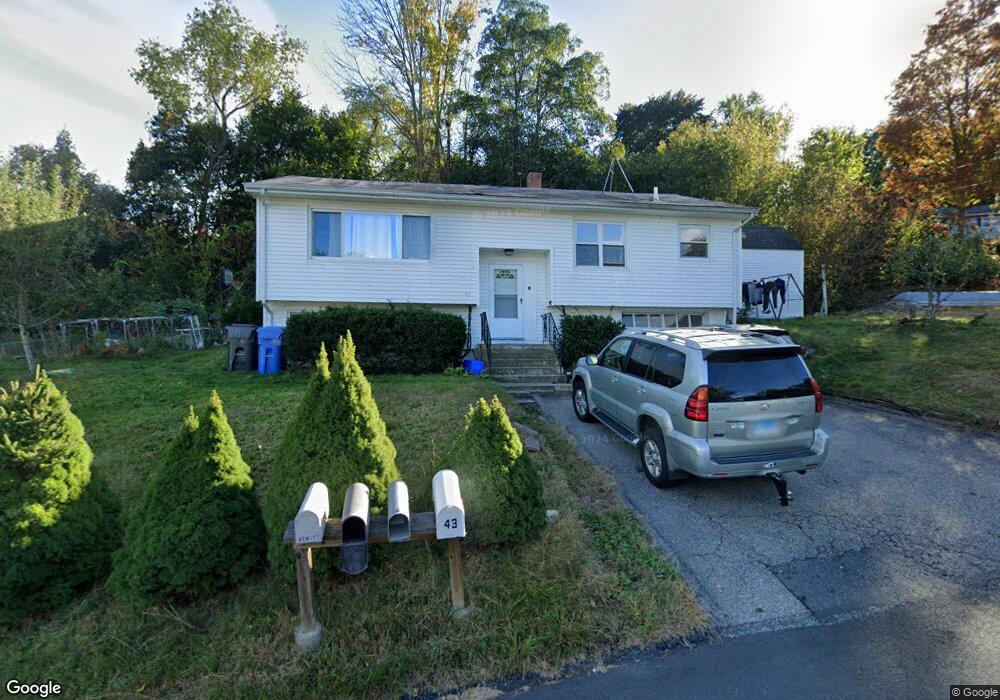
40 Holly Hill Dr Uncasville, CT 06382
Estimated Value: $295,000 - $376,000
5
Beds
3
Baths
1,078
Sq Ft
$321/Sq Ft
Est. Value
About This Home
This home is located at 40 Holly Hill Dr, Uncasville, CT 06382 and is currently estimated at $345,951, approximately $320 per square foot. 40 Holly Hill Dr is a home located in New London County with nearby schools including Leonard J. Tyl Middle School, Montville High School, and Mayflower Montessori School.
Ownership History
Date
Name
Owned For
Owner Type
Purchase Details
Closed on
Jul 9, 2022
Sold by
Chen Ping Z
Bought by
Yu Zhong J
Current Estimated Value
Purchase Details
Closed on
Sep 10, 2013
Sold by
Yu Ri S
Bought by
Chen Ping Z
Purchase Details
Closed on
Jun 10, 2002
Sold by
Rodriguez Alejo
Bought by
Chen Ping Zi and Yu Ri Sheng
Home Financials for this Owner
Home Financials are based on the most recent Mortgage that was taken out on this home.
Original Mortgage
$100,000
Interest Rate
6.9%
Purchase Details
Closed on
Feb 18, 1994
Sold by
Hillerman Larry A and Hillerman Suzanne C
Bought by
Hall James A and Hall Marie A
Home Financials for this Owner
Home Financials are based on the most recent Mortgage that was taken out on this home.
Original Mortgage
$117,300
Interest Rate
7.18%
Mortgage Type
Unknown
Create a Home Valuation Report for This Property
The Home Valuation Report is an in-depth analysis detailing your home's value as well as a comparison with similar homes in the area
Home Values in the Area
Average Home Value in this Area
Purchase History
| Date | Buyer | Sale Price | Title Company |
|---|---|---|---|
| Yu Zhong J | -- | None Available | |
| Yu Zhong J | -- | None Available | |
| Chen Ping Z | -- | -- | |
| Chen Ping Z | -- | -- | |
| Chen Ping Zi | $180,000 | -- | |
| Chen Ping Zi | $180,000 | -- | |
| Hall James A | $115,000 | -- | |
| Hall James A | $115,000 | -- |
Source: Public Records
Mortgage History
| Date | Status | Borrower | Loan Amount |
|---|---|---|---|
| Previous Owner | Hall James A | $100,000 | |
| Previous Owner | Hall James A | $118,500 | |
| Previous Owner | Hall James A | $117,300 |
Source: Public Records
Tax History Compared to Growth
Tax History
| Year | Tax Paid | Tax Assessment Tax Assessment Total Assessment is a certain percentage of the fair market value that is determined by local assessors to be the total taxable value of land and additions on the property. | Land | Improvement |
|---|---|---|---|---|
| 2025 | $3,892 | $134,820 | $31,920 | $102,900 |
| 2024 | $3,744 | $134,820 | $31,920 | $102,900 |
| 2023 | $3,744 | $134,820 | $31,920 | $102,900 |
| 2022 | $3,601 | $134,820 | $31,920 | $102,900 |
| 2021 | $3,439 | $108,320 | $31,100 | $77,220 |
| 2020 | $3,507 | $108,320 | $31,100 | $77,220 |
| 2019 | $3,521 | $108,320 | $31,100 | $77,220 |
| 2018 | $3,437 | $108,320 | $31,100 | $77,220 |
| 2017 | $3,434 | $108,320 | $31,100 | $77,220 |
| 2016 | $3,787 | $123,720 | $38,770 | $84,950 |
| 2015 | $3,787 | $123,720 | $38,770 | $84,950 |
| 2014 | $3,634 | $123,720 | $38,770 | $84,950 |
Source: Public Records
Map
Nearby Homes
- 124 Holly Hill Dr
- 19 Desjardins Dr
- 32 Cedar Ln
- 60 Fort Shantok Rd
- 1622 Old Pond Ln Unit 1622
- 586 W Thames St Unit 610
- 61 Fort Shantok Rd
- 527 W Thames St Unit 9
- 527 W Thames St Unit 27
- 87 Fort Shantok Rd
- 2057 Norwich New London Turnpike
- 102 Lucas Park Rd
- 9 Thamesview Rd
- 4 Traders Ct
- 4 Maplewood Ct
- 6 Perry Ave
- 114 Park Ave
- 27 Sycamore Rd
- 520 New London Turnpike
- 547 Old Laurel Hill Rd
- 71 Holly Hill Dr
- 76 Holly Hill Dr
- 41 Holly Hill Dr
- 43 Holly Hill Dr
- 67 Holly Hill Dr
- 75 Holly Hill Dr
- 37 Holly Hill Dr
- 80 Holly Hill Dr
- 23 Holly Hill Dr
- 63 Holly Hill Dr
- 15 Scenic Dr
- 79 Holly Hill Dr
- 19 Scenic Dr
- 19 Ann Ave
- 19 Holly Hill Dr
- 11 Scenic Dr
- 84 Holly Hill Dr
- 23 Scenic Dr
- 16 Ann Ave
- 19R Marie Ave