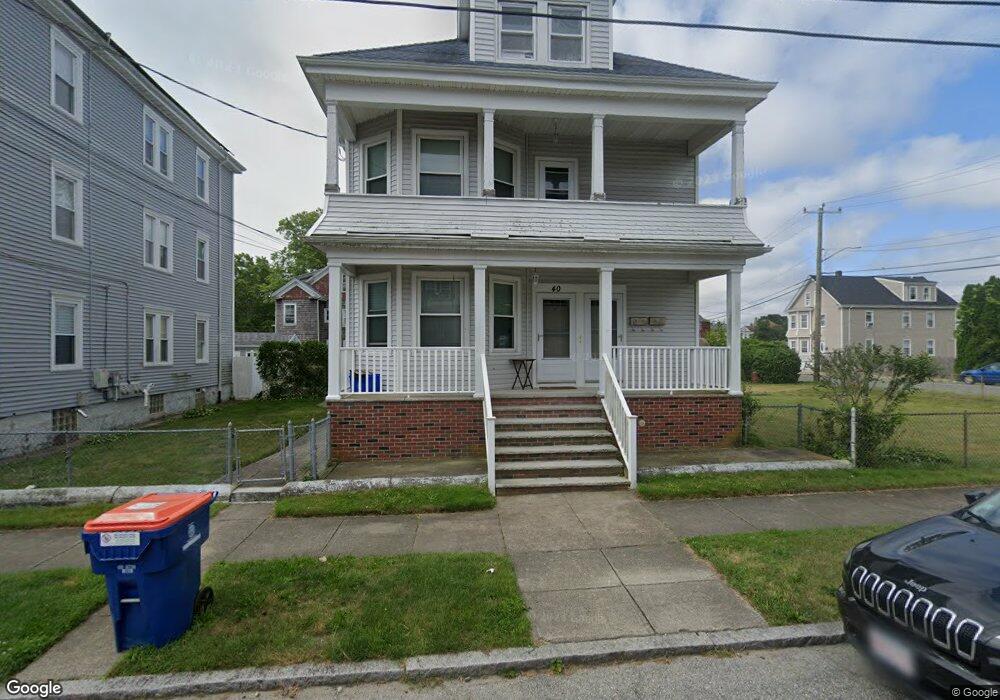
40 Hollyhock St Unit 42 New Bedford, MA 02740
The South End NeighborhoodEstimated Value: $566,775 - $681,000
6
Beds
2
Baths
2,800
Sq Ft
$225/Sq Ft
Est. Value
About This Home
This home is located at 40 Hollyhock St Unit 42, New Bedford, MA 02740 and is currently estimated at $630,694, approximately $225 per square foot. 40 Hollyhock St Unit 42 is a home located in Bristol County with nearby schools including James B. Congdon Elementary, Roosevelt Middle School, and New Bedford High School.
Ownership History
Date
Name
Owned For
Owner Type
Purchase Details
Closed on
Aug 27, 2002
Sold by
Mendes Jose C and Mendes Ana P
Bought by
Rodrigues Fernando M and Rodrigues Maria F
Current Estimated Value
Home Financials for this Owner
Home Financials are based on the most recent Mortgage that was taken out on this home.
Original Mortgage
$179,000
Outstanding Balance
$76,572
Interest Rate
6.57%
Mortgage Type
Purchase Money Mortgage
Estimated Equity
$554,122
Purchase Details
Closed on
Mar 24, 1995
Sold by
Camara Glenn M and Camara Patricia A
Bought by
Mendes Jose C and Mendes Ana P
Purchase Details
Closed on
Aug 14, 1989
Sold by
Almeida Lorene M
Bought by
Camara Glenn M
Create a Home Valuation Report for This Property
The Home Valuation Report is an in-depth analysis detailing your home's value as well as a comparison with similar homes in the area
Home Values in the Area
Average Home Value in this Area
Purchase History
| Date | Buyer | Sale Price | Title Company |
|---|---|---|---|
| Rodrigues Fernando M | $224,000 | -- | |
| Rodrigues Fernando M | $224,000 | -- | |
| Mendes Jose C | $106,000 | -- | |
| Mendes Jose C | $106,000 | -- | |
| Camara Glenn M | $75,000 | -- |
Source: Public Records
Mortgage History
| Date | Status | Borrower | Loan Amount |
|---|---|---|---|
| Open | Camara Glenn M | $179,000 | |
| Closed | Camara Glenn M | $179,000 | |
| Previous Owner | Camara Glenn M | $8,000 |
Source: Public Records
Tax History Compared to Growth
Tax History
| Year | Tax Paid | Tax Assessment Tax Assessment Total Assessment is a certain percentage of the fair market value that is determined by local assessors to be the total taxable value of land and additions on the property. | Land | Improvement |
|---|---|---|---|---|
| 2025 | $5,784 | $511,400 | $112,700 | $398,700 |
| 2024 | $5,083 | $423,600 | $108,700 | $314,900 |
| 2023 | $5,072 | $354,900 | $91,000 | $263,900 |
| 2022 | $4,646 | $299,000 | $88,600 | $210,400 |
| 2021 | $4,599 | $295,000 | $84,600 | $210,400 |
| 2020 | $4,423 | $273,700 | $84,600 | $189,100 |
| 2019 | $4,318 | $262,200 | $84,600 | $177,600 |
| 2018 | $4,041 | $243,000 | $84,600 | $158,400 |
| 2017 | $3,670 | $219,900 | $86,600 | $133,300 |
| 2016 | $3,531 | $214,100 | $86,600 | $127,500 |
| 2015 | $3,299 | $209,700 | $86,600 | $123,100 |
| 2014 | $3,179 | $209,700 | $86,600 | $123,100 |
Source: Public Records
Map
Nearby Homes