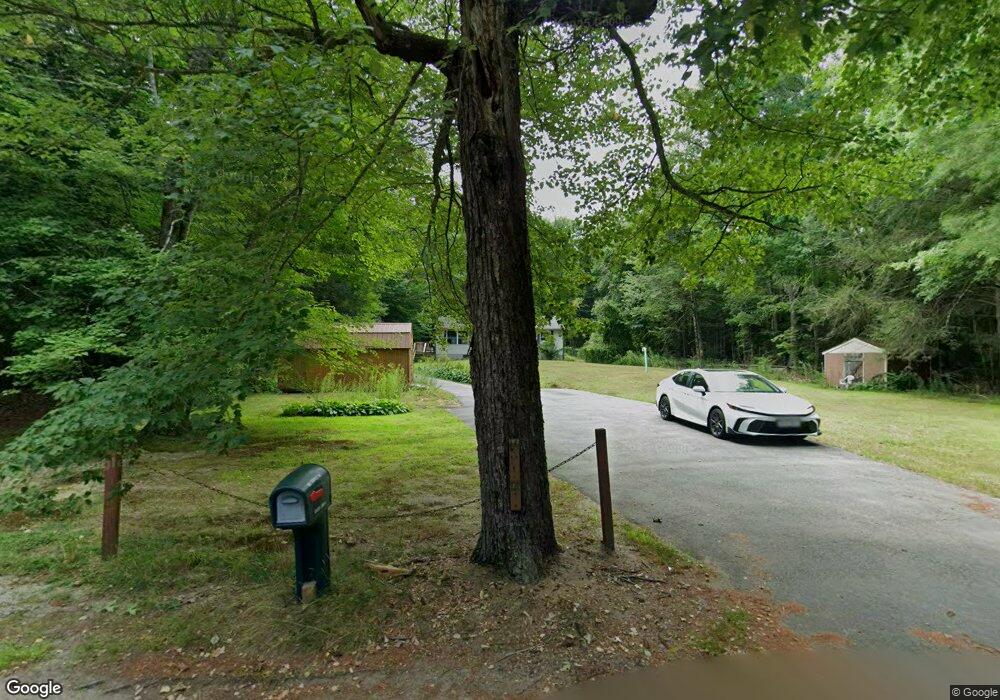
40 Horton Rd Orange, MA 01364
Estimated Value: $314,422 - $488,000
3
Beds
1
Bath
1,008
Sq Ft
$383/Sq Ft
Est. Value
About This Home
This home is located at 40 Horton Rd, Orange, MA 01364 and is currently estimated at $385,856, approximately $382 per square foot. 40 Horton Rd is a home located in Franklin County with nearby schools including Fisher Hill and Ralph C Mahar Regional School.
Ownership History
Date
Name
Owned For
Owner Type
Purchase Details
Closed on
Nov 21, 2001
Sold by
Patria Brian and Patria Kelli
Bought by
Doddge William A
Current Estimated Value
Home Financials for this Owner
Home Financials are based on the most recent Mortgage that was taken out on this home.
Original Mortgage
$124,019
Interest Rate
6.64%
Mortgage Type
Purchase Money Mortgage
Purchase Details
Closed on
Jun 30, 1998
Sold by
Condon Richard M
Bought by
Patria Brian and Cleveland Kelli
Create a Home Valuation Report for This Property
The Home Valuation Report is an in-depth analysis detailing your home's value as well as a comparison with similar homes in the area
Home Values in the Area
Average Home Value in this Area
Purchase History
| Date | Buyer | Sale Price | Title Company |
|---|---|---|---|
| Doddge William A | $125,000 | -- | |
| Patria Brian | $80,000 | -- |
Source: Public Records
Mortgage History
| Date | Status | Borrower | Loan Amount |
|---|---|---|---|
| Open | Patria Brian | $128,250 | |
| Closed | Patria Brian | $3,755 | |
| Closed | Patria Brian | $128,250 | |
| Closed | Patria Brian | $124,019 |
Source: Public Records
Tax History Compared to Growth
Tax History
| Year | Tax Paid | Tax Assessment Tax Assessment Total Assessment is a certain percentage of the fair market value that is determined by local assessors to be the total taxable value of land and additions on the property. | Land | Improvement |
|---|---|---|---|---|
| 2025 | $45 | $275,500 | $37,200 | $238,300 |
| 2024 | $3,989 | $228,700 | $37,200 | $191,500 |
| 2023 | $3,799 | $211,500 | $37,200 | $174,300 |
| 2022 | $3,564 | $186,400 | $37,200 | $149,200 |
| 2021 | $3,154 | $157,300 | $49,900 | $107,400 |
| 2020 | $3,163 | $155,600 | $47,700 | $107,900 |
| 2019 | $2,907 | $129,100 | $42,600 | $86,500 |
| 2018 | $2,753 | $125,500 | $41,300 | $84,200 |
| 2017 | $2,664 | $125,500 | $41,300 | $84,200 |
| 2016 | $2,676 | $123,300 | $41,300 | $82,000 |
| 2015 | $2,507 | $120,700 | $36,900 | $83,800 |
| 2014 | $2,359 | $119,500 | $32,600 | $86,900 |
Source: Public Records
Map
Nearby Homes