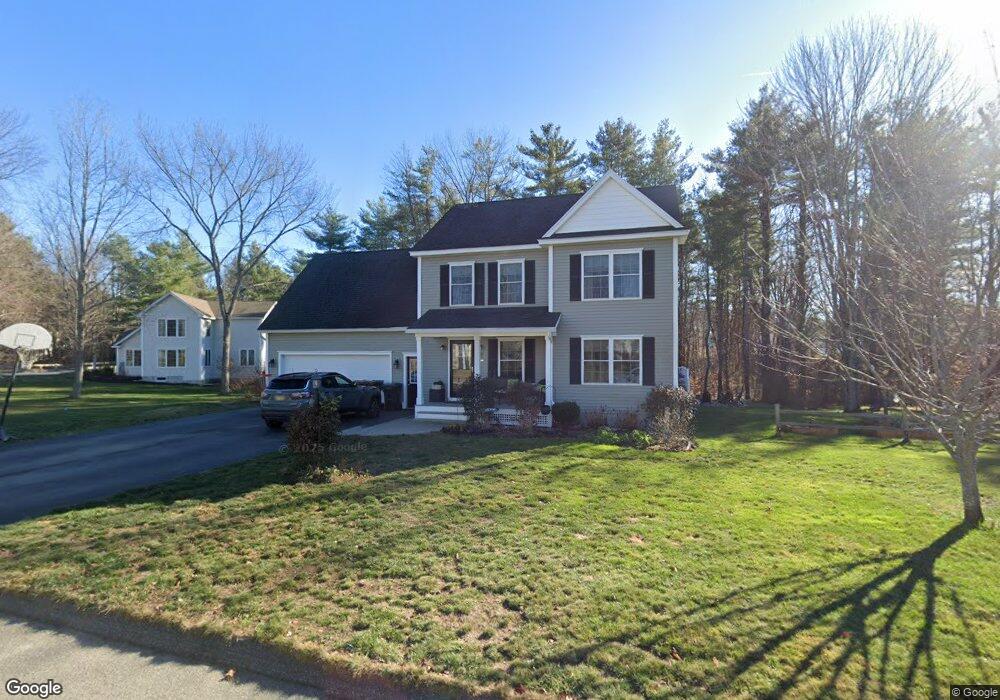
40 Hubbard St Saco, ME 04072
Central Saco NeighborhoodEstimated Value: $535,000 - $694,000
3
Beds
2
Baths
1,908
Sq Ft
$319/Sq Ft
Est. Value
About This Home
This home is located at 40 Hubbard St, Saco, ME 04072 and is currently estimated at $608,728, approximately $319 per square foot. 40 Hubbard St is a home with nearby schools including C K Burns School, Saco Middle School, and Saint James School.
Ownership History
Date
Name
Owned For
Owner Type
Purchase Details
Closed on
Oct 2, 2013
Sold by
Roberge John B
Bought by
Roberge Construction Inc and Burgess Angela M
Current Estimated Value
Home Financials for this Owner
Home Financials are based on the most recent Mortgage that was taken out on this home.
Original Mortgage
$310,885
Outstanding Balance
$233,209
Interest Rate
4.61%
Mortgage Type
New Conventional
Estimated Equity
$375,519
Purchase Details
Closed on
Jan 4, 2005
Sold by
E & R Dev Corp
Bought by
Roberge John B
Create a Home Valuation Report for This Property
The Home Valuation Report is an in-depth analysis detailing your home's value as well as a comparison with similar homes in the area
Home Values in the Area
Average Home Value in this Area
Purchase History
| Date | Buyer | Sale Price | Title Company |
|---|---|---|---|
| Roberge Construction Inc | -- | -- | |
| Burgess Craig A | -- | -- | |
| Roberge Construction Inc | -- | -- | |
| Roberge John B | -- | -- | |
| Roberge John B | -- | -- |
Source: Public Records
Mortgage History
| Date | Status | Borrower | Loan Amount |
|---|---|---|---|
| Open | Burgess Craig A | $310,885 | |
| Closed | Roberge John B | $0 |
Source: Public Records
Tax History Compared to Growth
Tax History
| Year | Tax Paid | Tax Assessment Tax Assessment Total Assessment is a certain percentage of the fair market value that is determined by local assessors to be the total taxable value of land and additions on the property. | Land | Improvement |
|---|---|---|---|---|
| 2024 | $6,376 | $453,804 | $138,404 | $315,400 |
| 2023 | $6,694 | $453,804 | $138,404 | $315,400 |
| 2022 | $5,939 | $324,000 | $105,800 | $218,200 |
| 2021 | $5,388 | $285,400 | $95,400 | $190,000 |
| 2020 | $5,150 | $261,800 | $86,400 | $175,400 |
| 2019 | $5,074 | $261,800 | $86,400 | $175,400 |
| 2018 | $4,924 | $254,100 | $79,500 | $174,600 |
| 2017 | $4,971 | $256,500 | $79,500 | $177,000 |
| 2016 | $4,610 | $237,400 | $70,700 | $166,700 |
| 2015 | $4,522 | $235,300 | $70,700 | $164,600 |
| 2014 | $4,381 | $235,300 | $70,700 | $164,600 |
| 2013 | $4,372 | $235,300 | $70,700 | $164,600 |
Source: Public Records
Map
Nearby Homes
- 7 Hubbard St
- 242 Lincoln St
- 52 Maple St
- 3 Labonte Ave E
- 11 Brentwood Cir
- 104 Hill St Unit 1
- 91 Bradley St
- 391 Main St
- 24 Dyer St
- 43 New County Rd
- 32 Park St
- 6 Maple St
- 674 South St
- 12 Shadagee Rd
- 48 Garfield St Unit 9
- 143 Pleasant St
- 117 Temple St
- 48 Hillview Ave
- 20 Upper Falls Rd Unit 501
- 20 Upper Falls Rd Unit 403