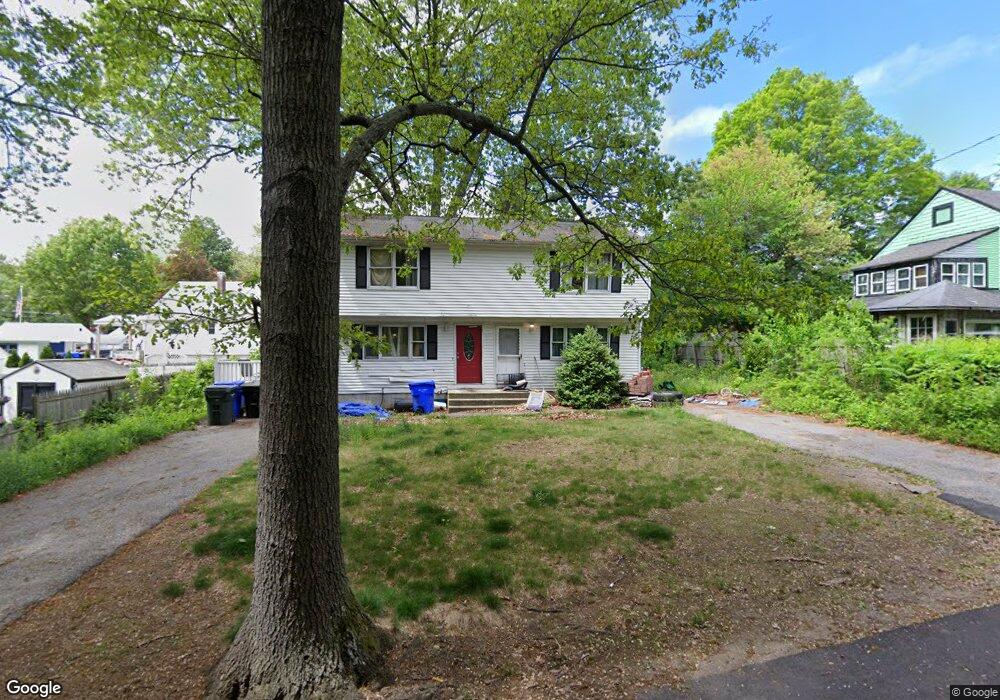
40 Ivanhoe St Unit 42 Springfield, MA 01109
Pine Point NeighborhoodEstimated Value: $330,570 - $441,000
4
Beds
2
Baths
1,944
Sq Ft
$191/Sq Ft
Est. Value
About This Home
This home is located at 40 Ivanhoe St Unit 42, Springfield, MA 01109 and is currently estimated at $372,143, approximately $191 per square foot. 40 Ivanhoe St Unit 42 is a home located in Hampden County with nearby schools including Thomas M Balliet Elementary School, John J Duggan Middle, and Roger L. Putnam Vocational Technical Academy.
Ownership History
Date
Name
Owned For
Owner Type
Purchase Details
Closed on
Nov 30, 2001
Sold by
Wheeler Donald J
Bought by
Melbourne Damaen
Current Estimated Value
Home Financials for this Owner
Home Financials are based on the most recent Mortgage that was taken out on this home.
Original Mortgage
$104,077
Outstanding Balance
$40,940
Interest Rate
6.66%
Mortgage Type
Purchase Money Mortgage
Estimated Equity
$331,203
Create a Home Valuation Report for This Property
The Home Valuation Report is an in-depth analysis detailing your home's value as well as a comparison with similar homes in the area
Home Values in the Area
Average Home Value in this Area
Purchase History
| Date | Buyer | Sale Price | Title Company |
|---|---|---|---|
| Melbourne Damaen | $104,900 | -- |
Source: Public Records
Mortgage History
| Date | Status | Borrower | Loan Amount |
|---|---|---|---|
| Open | Melbourne Damaen | $104,077 | |
| Previous Owner | Melbourne Damaen | $74,200 | |
| Previous Owner | Melbourne Damaen | $70,000 | |
| Previous Owner | Melbourne Damaen | $70,000 |
Source: Public Records
Tax History
| Year | Tax Paid | Tax Assessment Tax Assessment Total Assessment is a certain percentage of the fair market value that is determined by local assessors to be the total taxable value of land and additions on the property. | Land | Improvement |
|---|---|---|---|---|
| 2025 | $4,875 | $310,900 | $39,600 | $271,300 |
| 2024 | $4,547 | $283,100 | $33,000 | $250,100 |
| 2023 | $4,349 | $255,100 | $30,000 | $225,100 |
| 2022 | $4,150 | $220,500 | $28,000 | $192,500 |
| 2021 | $3,738 | $197,800 | $25,500 | $172,300 |
| 2020 | $3,691 | $189,000 | $25,500 | $163,500 |
| 2019 | $3,328 | $169,100 | $25,500 | $143,600 |
| 2018 | $3,174 | $161,300 | $25,500 | $135,800 |
| 2017 | $2,906 | $147,800 | $23,600 | $124,200 |
| 2016 | $2,839 | $144,400 | $23,600 | $120,800 |
| 2015 | $2,738 | $139,200 | $23,600 | $115,600 |
Source: Public Records
Map
Nearby Homes
Your Personal Tour Guide
Ask me questions while you tour the home.