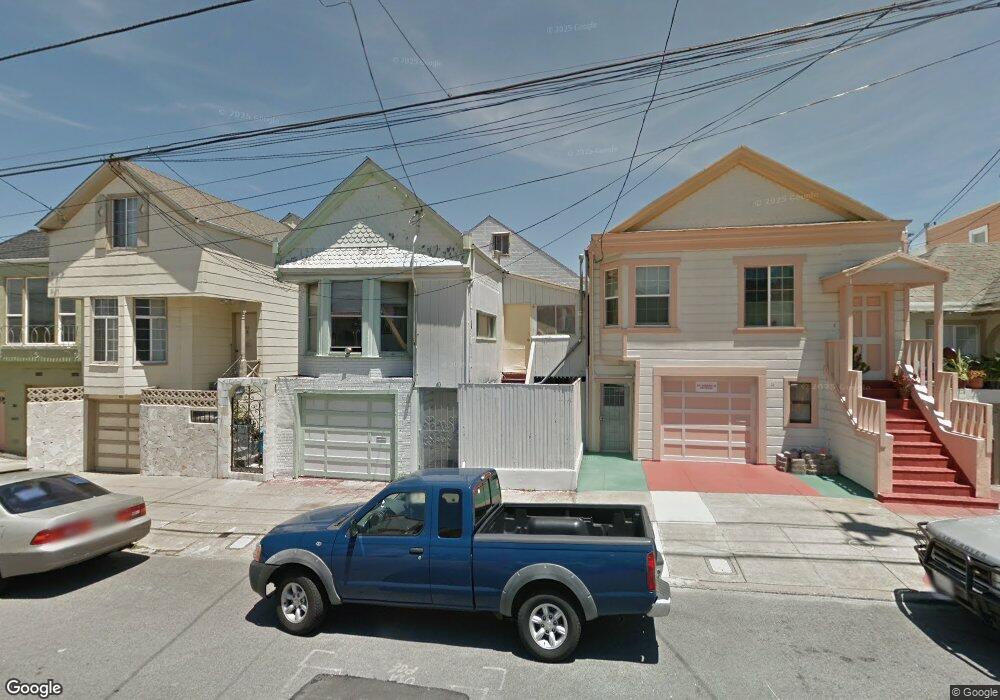
40 Liebig St San Francisco, CA 94112
Outer Mission NeighborhoodEstimated Value: $881,000 - $1,295,000
3
Beds
1
Bath
1,224
Sq Ft
$845/Sq Ft
Est. Value
About This Home
This home is located at 40 Liebig St, San Francisco, CA 94112 and is currently estimated at $1,033,853, approximately $844 per square foot. 40 Liebig St is a home located in San Francisco County with nearby schools including Longfellow Elementary School, Denman (James) Middle School, and San Francisco Christian School.
Ownership History
Date
Name
Owned For
Owner Type
Purchase Details
Closed on
Jun 16, 2003
Sold by
Li Wukang and Liu Xiaoy An
Bought by
Liu Xiaoyan
Current Estimated Value
Purchase Details
Closed on
Apr 17, 2001
Sold by
Xiaoyan Li Wukang Liu
Bought by
Li Wukang and Liu Xiaoyan
Home Financials for this Owner
Home Financials are based on the most recent Mortgage that was taken out on this home.
Original Mortgage
$116,000
Interest Rate
6.52%
Create a Home Valuation Report for This Property
The Home Valuation Report is an in-depth analysis detailing your home's value as well as a comparison with similar homes in the area
Home Values in the Area
Average Home Value in this Area
Purchase History
| Date | Buyer | Sale Price | Title Company |
|---|---|---|---|
| Liu Xiaoyan | -- | -- | |
| Li Wukang | -- | Financial Title Company |
Source: Public Records
Mortgage History
| Date | Status | Borrower | Loan Amount |
|---|---|---|---|
| Closed | Li Wukang | $116,000 |
Source: Public Records
Tax History Compared to Growth
Tax History
| Year | Tax Paid | Tax Assessment Tax Assessment Total Assessment is a certain percentage of the fair market value that is determined by local assessors to be the total taxable value of land and additions on the property. | Land | Improvement |
|---|---|---|---|---|
| 2025 | $3,830 | $271,912 | $135,956 | $135,956 |
| 2024 | $3,830 | $266,582 | $133,291 | $133,291 |
| 2023 | $3,761 | $261,356 | $130,678 | $130,678 |
| 2022 | $3,673 | $256,232 | $128,116 | $128,116 |
| 2021 | $3,601 | $251,208 | $125,604 | $125,604 |
| 2020 | $3,636 | $248,634 | $124,317 | $124,317 |
| 2019 | $3,515 | $243,760 | $121,880 | $121,880 |
| 2018 | $3,396 | $238,982 | $119,491 | $119,491 |
| 2017 | $3,056 | $234,298 | $117,149 | $117,149 |
| 2016 | $2,978 | $229,704 | $114,852 | $114,852 |
| 2015 | $2,938 | $226,254 | $113,127 | $113,127 |
| 2014 | $2,861 | $221,822 | $110,911 | $110,911 |
Source: Public Records
Map
Nearby Homes
- 3223 San Jose Ave
- 3268 San Jose Ave
- 900 Huron Ave
- 713 Acton St
- 961 Hanover St
- 2921 Alemany Blvd
- 106 Broad St
- 230 Rhine St
- 42 Farragut Ave
- 5698 Mission St
- 895 Bellevue Ave
- 891 Bellevue Ave
- 788 Templeton Ave
- 502 Plymouth Ave
- 100 Chelsea Ct Unit B
- 395 Frankfort St
- 63 Minerva St
- 440 Pointe Pacific Unit 3
- 95 Santa Cruz Ave
- 171 Margaret Ave