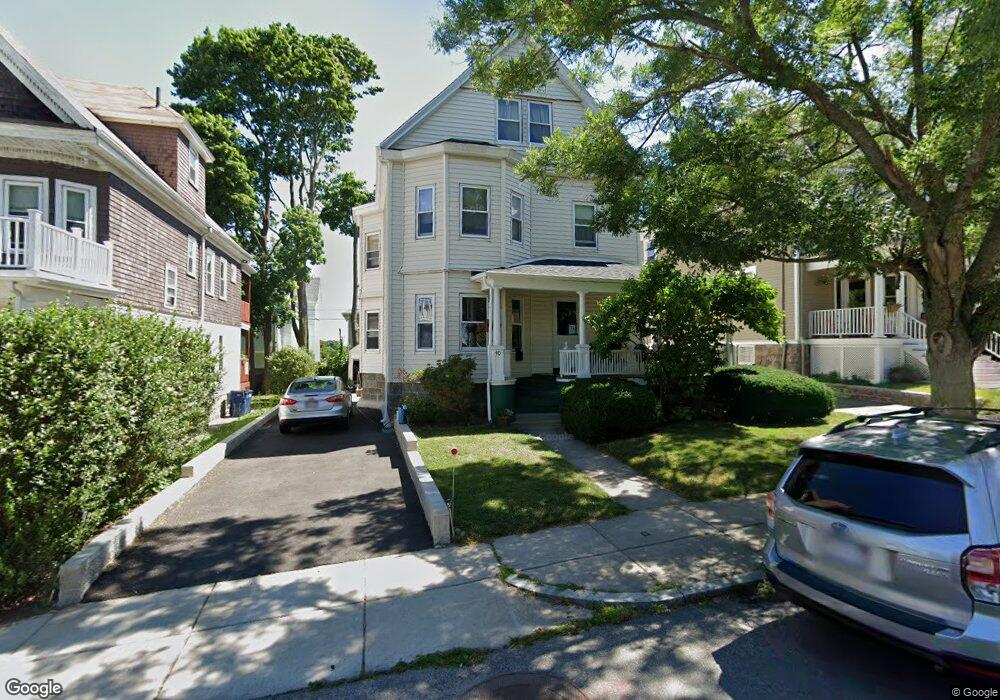
40 Lorraine St Roslindale, MA 02131
Roslindale NeighborhoodEstimated Value: $874,000 - $957,000
4
Beds
2
Baths
1,858
Sq Ft
$488/Sq Ft
Est. Value
About This Home
This home is located at 40 Lorraine St, Roslindale, MA 02131 and is currently estimated at $907,225, approximately $488 per square foot. 40 Lorraine St is a home located in Suffolk County with nearby schools including Holy Name Parish School and The Roxbury Latin School.
Ownership History
Date
Name
Owned For
Owner Type
Purchase Details
Closed on
Oct 30, 1995
Sold by
Fhlmc
Bought by
Rigg Charles H and Snudden Nancy J
Current Estimated Value
Purchase Details
Closed on
Feb 10, 1995
Sold by
Mallare Rodrigo N and Mallare Fhlmc
Bought by
Fhlmc
Purchase Details
Closed on
Apr 23, 1988
Sold by
Kalemkiarian Vahe
Bought by
Chin Frederick K
Create a Home Valuation Report for This Property
The Home Valuation Report is an in-depth analysis detailing your home's value as well as a comparison with similar homes in the area
Home Values in the Area
Average Home Value in this Area
Purchase History
| Date | Buyer | Sale Price | Title Company |
|---|---|---|---|
| Rigg Charles H | $124,500 | -- | |
| Fhlmc | $110,000 | -- | |
| Chin Frederick K | $167,500 | -- |
Source: Public Records
Mortgage History
| Date | Status | Borrower | Loan Amount |
|---|---|---|---|
| Open | Chin Frederick K | $170,000 | |
| Closed | Chin Frederick K | $36,000 |
Source: Public Records
Tax History Compared to Growth
Tax History
| Year | Tax Paid | Tax Assessment Tax Assessment Total Assessment is a certain percentage of the fair market value that is determined by local assessors to be the total taxable value of land and additions on the property. | Land | Improvement |
|---|---|---|---|---|
| 2025 | $9,204 | $794,800 | $258,900 | $535,900 |
| 2024 | $8,367 | $767,600 | $274,900 | $492,700 |
| 2023 | $7,850 | $730,900 | $261,700 | $469,200 |
| 2022 | $7,100 | $652,600 | $233,700 | $418,900 |
| 2021 | $6,445 | $604,000 | $222,600 | $381,400 |
| 2020 | $6,196 | $586,700 | $200,100 | $386,600 |
| 2019 | $5,765 | $547,000 | $164,200 | $382,800 |
| 2018 | $5,309 | $506,600 | $164,200 | $342,400 |
| 2017 | $5,014 | $473,500 | $164,200 | $309,300 |
| 2016 | $5,057 | $459,700 | $164,200 | $295,500 |
| 2015 | $5,089 | $420,200 | $135,700 | $284,500 |
| 2014 | $4,802 | $381,700 | $135,700 | $246,000 |
Source: Public Records
Map
Nearby Homes
- 95 Newburg St
- 59 Aldrich St Unit 2
- 311 Belgrade Ave
- 257 Belgrade Ave
- 242 Belgrade Ave
- 152 Stratford St
- 416 Belgrade Ave Unit 25
- 15 Newburg St Unit 1
- 239 Stratford St
- 276 Cornell St
- 43 Ainsworth St Unit 2
- 73 Woodard Rd
- 26 Bradfield Ave Unit 3
- 17 Metcalf St
- 0 Averton St
- 34 Averton St
- 112 Roslindale Ave Unit 2
- 275 Bellevue St
- 1789 Centre St Unit 202
- 103 Belgrade Ave Unit 2
- 36 Lorraine St
- 36 Lorraine St
- 36 Lorraine St Unit 2
- 36 Lorraine St Unit 1
- 44 Lorraine St
- 48 Lorraine St
- 57 Montvale St
- 57 Montvale St Unit 1
- 32 Lorraine St
- 32 Lorraine St Unit 3
- 61 Montvale St
- 53 Montvale St
- 53 Montvale St Unit 2
- 53 Montvale St Unit 1
- 65 Montvale St
- 49 Montvale St Unit 1
- 49 Montvale St
- 49 Montvale St Unit 2
- 39 Lorraine St
- 52 Lorraine St