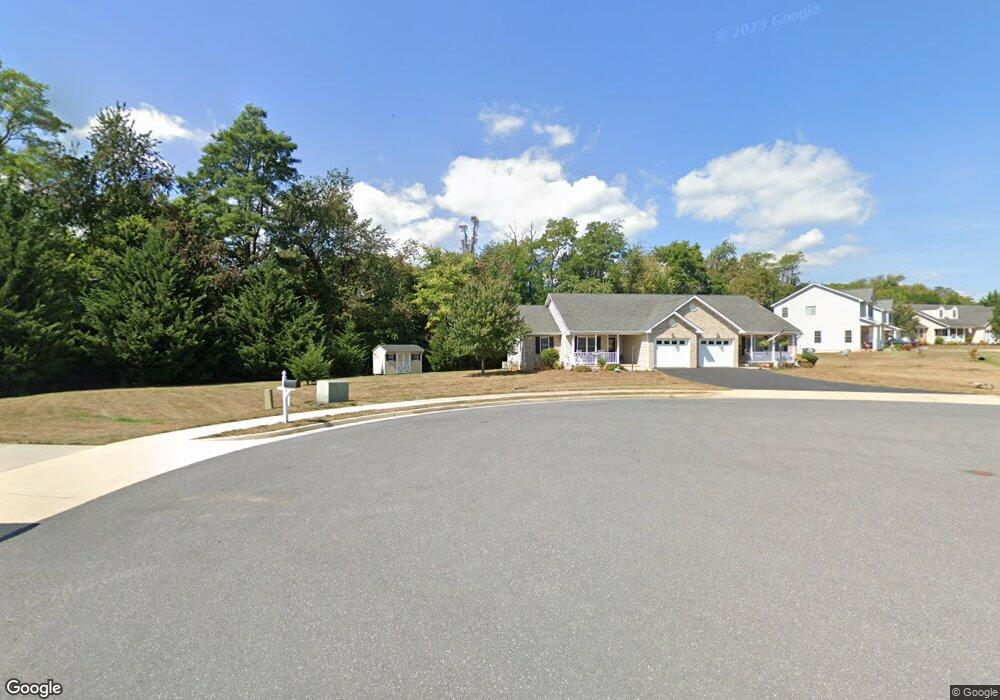
40 Meriwether Cir Stuarts Draft, VA 24477
Estimated Value: $324,792 - $358,000
2
Beds
2
Baths
1,358
Sq Ft
$251/Sq Ft
Est. Value
About This Home
This home is located at 40 Meriwether Cir, Stuarts Draft, VA 24477 and is currently estimated at $341,448, approximately $251 per square foot. 40 Meriwether Cir is a home located in Augusta County with nearby schools including Stuarts Draft Elementary School, Stuarts Draft Middle School, and Stuarts Draft High School.
Ownership History
Date
Name
Owned For
Owner Type
Purchase Details
Closed on
Aug 24, 2018
Sold by
Lofton Leasing Llc
Bought by
Schrock Sadie M
Current Estimated Value
Purchase Details
Closed on
Mar 30, 2015
Sold by
Lofton Leasing Llc A Virginia Limited Li
Bought by
Oscorp Holdings Llc 40 Meriwether Series
Home Financials for this Owner
Home Financials are based on the most recent Mortgage that was taken out on this home.
Original Mortgage
$202,410
Interest Rate
3.75%
Mortgage Type
New Conventional
Purchase Details
Closed on
Mar 24, 2011
Sold by
Farmers & Merchants Bank
Bought by
Lofton Leasing Llc
Home Financials for this Owner
Home Financials are based on the most recent Mortgage that was taken out on this home.
Original Mortgage
$142,500
Interest Rate
4.99%
Mortgage Type
Credit Line Revolving
Purchase Details
Closed on
Dec 31, 2010
Sold by
Rutherford Ventures Llc
Bought by
Farmers & Merchants Bank
Create a Home Valuation Report for This Property
The Home Valuation Report is an in-depth analysis detailing your home's value as well as a comparison with similar homes in the area
Purchase History
| Date | Buyer | Sale Price | Title Company |
|---|---|---|---|
| Schrock Sadie M | $235,000 | -- | |
| Oscorp Holdings Llc 40 Meriwether Series | $224,900 | Attorney | |
| Lofton Leasing Llc | $1,160,000 | None Available | |
| Farmers & Merchants Bank | $1,120,099 | None Available |
Source: Public Records
Mortgage History
| Date | Status | Borrower | Loan Amount |
|---|---|---|---|
| Previous Owner | Oscorp Holdings Llc 40 Meriwether Series | $202,410 | |
| Previous Owner | Lofton Leasing Llc | $142,500 |
Source: Public Records
Tax History
| Year | Tax Paid | Tax Assessment Tax Assessment Total Assessment is a certain percentage of the fair market value that is determined by local assessors to be the total taxable value of land and additions on the property. | Land | Improvement |
|---|---|---|---|---|
| 2025 | $1,583 | $304,400 | $60,000 | $244,400 |
| 2024 | $1,608 | $309,200 | $60,000 | $249,200 |
| 2023 | $1,489 | $236,300 | $50,000 | $186,300 |
| 2022 | $1,489 | $236,300 | $50,000 | $186,300 |
| 2021 | $1,489 | $236,300 | $50,000 | $186,300 |
| 2020 | $1,489 | $236,300 | $50,000 | $186,300 |
| 2019 | $1,489 | $236,300 | $50,000 | $186,300 |
| 2018 | $1,105 | $175,371 | $50,000 | $125,371 |
| 2017 | $1,017 | $175,371 | $50,000 | $125,371 |
| 2016 | $1,017 | $175,371 | $50,000 | $125,371 |
| 2015 | $865 | $175,371 | $50,000 | $125,371 |
| 2014 | $865 | $175,371 | $50,000 | $125,371 |
| 2013 | $865 | $180,200 | $50,000 | $130,200 |
Source: Public Records
Map
Nearby Homes
- 81 Meriwether Cir
- 151 Stuart Ave
- 42 Lynn Cir
- 153 Sylvan Dr
- TBD Tinkling Spring Rd
- 36 Skyline Ave
- 165 Lofty Cir
- 62 Fossil Dr
- 68 Fossil Dr
- 66 Fossil Dr
- 86 Lookover Terrace
- 14 Lookover Terrace
- 0 Johnson Dr Unit 663189
- 162 Locust Grove Ln
- 36 Buckboard Rd
- 911 Old White Hill Rd
- 3318 Stuarts Draft Hwy
- 000 Stuarts Draft Hwy
- 634 Augusta Farms Rd
- 241 Bowmans Run Dr
- 42 Meriwether Cir
- 48 Meriwether Cir
- 38 Meriwether Cir
- 50 Meriwether Cir
- 36 Meriwether Cir
- 36 Meriwether Cir Unit 14
- 27 Meriwether Cir
- 16 Meriwether Cir
- 34 Meriwether Cir
- 32 Meriwether Cir
- 49 Meriwether Cir
- 54 Meriwether Cir
- 25 Meriwether Cir
- 26 Meriwether Cir
- 17 Meriwether Cir
- 71 Meriwether Cir
- 2746 Stuarts Draft Hwy
- 62 Meriwether Cir
- 15 Meriwether Cir
- 15 Meriwether Cir
Your Personal Tour Guide
Ask me questions while you tour the home.