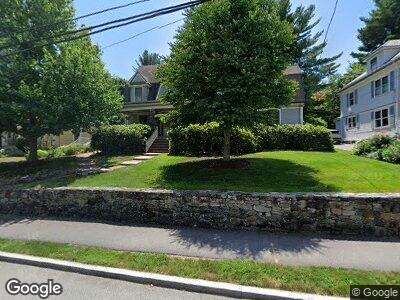
40 Nonantum St Newton, MA 02458
Newton Corner NeighborhoodEstimated Value: $1,975,878 - $2,178,000
4
Beds
4
Baths
3,089
Sq Ft
$680/Sq Ft
Est. Value
About This Home
This home is located at 40 Nonantum St, Newton, MA 02458 and is currently estimated at $2,099,970, approximately $679 per square foot. 40 Nonantum St is a home located in Middlesex County with nearby schools including Underwood Elementary School, Bigelow Middle School, and Newton North High School.
Ownership History
Date
Name
Owned For
Owner Type
Purchase Details
Closed on
Nov 22, 2019
Sold by
Katzen Welt and Katzen Amelia
Bought by
40 Nonantum Rt
Current Estimated Value
Create a Home Valuation Report for This Property
The Home Valuation Report is an in-depth analysis detailing your home's value as well as a comparison with similar homes in the area
Home Values in the Area
Average Home Value in this Area
Purchase History
| Date | Buyer | Sale Price | Title Company |
|---|---|---|---|
| 40 Nonantum Rt | -- | None Available |
Source: Public Records
Mortgage History
| Date | Status | Borrower | Loan Amount |
|---|---|---|---|
| Previous Owner | Katzen Amelia | $750,000 | |
| Previous Owner | Katzen Amelia W | $450,000 | |
| Previous Owner | Katzen Amelia W | $350,000 | |
| Previous Owner | Katzen Amelia W | $95,000 | |
| Previous Owner | Katzen Amelia W | $127,000 |
Source: Public Records
Tax History Compared to Growth
Tax History
| Year | Tax Paid | Tax Assessment Tax Assessment Total Assessment is a certain percentage of the fair market value that is determined by local assessors to be the total taxable value of land and additions on the property. | Land | Improvement |
|---|---|---|---|---|
| 2025 | $16,553 | $1,689,100 | $1,053,700 | $635,400 |
| 2024 | $16,005 | $1,639,900 | $1,023,000 | $616,900 |
| 2023 | $15,322 | $1,505,100 | $786,100 | $719,000 |
| 2022 | $14,661 | $1,393,600 | $727,900 | $665,700 |
| 2021 | $14,146 | $1,314,700 | $686,700 | $628,000 |
| 2020 | $13,725 | $1,314,700 | $686,700 | $628,000 |
| 2019 | $13,338 | $1,276,400 | $666,700 | $609,700 |
| 2018 | $12,997 | $1,201,200 | $601,900 | $599,300 |
| 2017 | $12,601 | $1,133,200 | $567,800 | $565,400 |
| 2016 | $12,053 | $1,059,100 | $530,700 | $528,400 |
| 2015 | $10,377 | $893,800 | $496,000 | $397,800 |
Source: Public Records
Map
Nearby Homes
- 11 Marlboro St
- 180 Franklin St
- 155 Waverley Ave
- 130-132 Nonantum St
- 121 Tremont St Unit B1
- 121 Tremont St Unit 1
- 121 Tremont St Unit A2
- 121 Tremont St Unit B4
- 4 Tremont Place Unit 4
- 99 Tremont St Unit 302
- 99 Tremont St Unit 413
- 99 Tremont St Unit 213
- 99 Tremont St Unit 303
- 99 Tremont St Unit 415
- 99 Tremont St Unit 310
- 99 Tremont St Unit 105
- 15 Farlow Rd
- 12 Valley Spring Rd
- 11 A Washington St
- 48 Nonantum St
- 40 Nonantum St
- 32 Nonantum St
- 46 Nonantum St
- 25 Shornecliffe Rd
- 31 Shornecliffe Rd
- 7 Shornecliffe Rd
- 39 Shornecliffe Rd
- 52 Nonantum St
- 39 Nonantum St
- 33 Nonantum St
- 45 Nonantum St
- 4 Arlington St
- 66 Marlboro St
- 58 Nonantum St
- 32 Shornecliffe Rd
- 45 Shornecliffe Rd
- 20 Arlington St
- 26 Shornecliffe Rd
- 22 Shornecliffe Rd
- 24 Arlington St