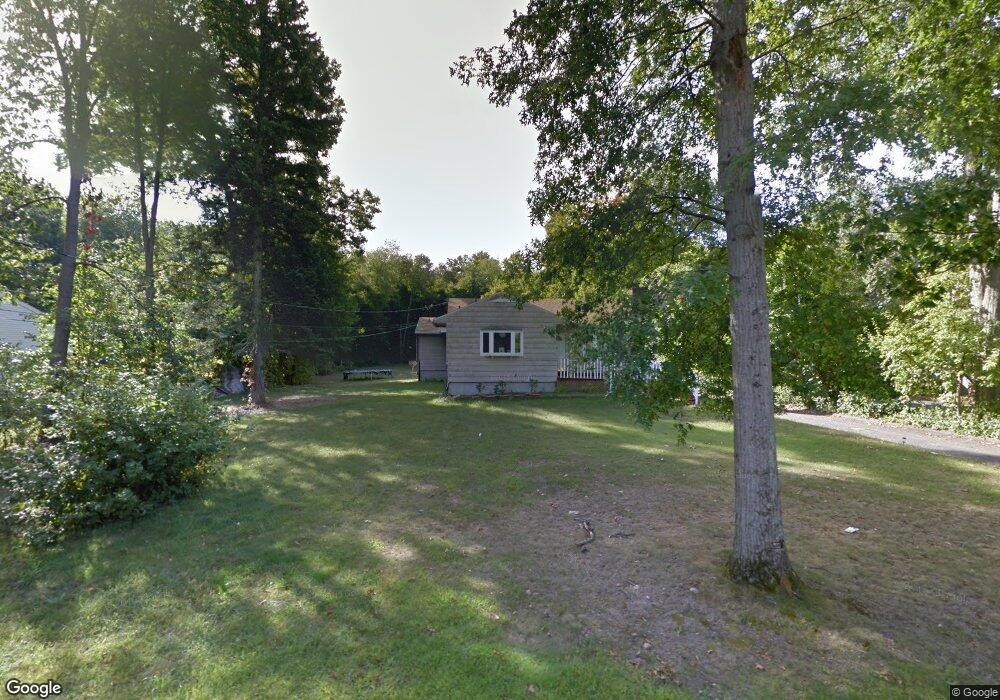
40 North Ave North Haven, CT 06473
Estimated Value: $422,000 - $480,000
5
Beds
3
Baths
1,800
Sq Ft
$255/Sq Ft
Est. Value
About This Home
This home is located at 40 North Ave, North Haven, CT 06473 and is currently estimated at $458,680, approximately $254 per square foot. 40 North Ave is a home located in New Haven County with nearby schools including North Haven Middle School and North Haven High School.
Ownership History
Date
Name
Owned For
Owner Type
Purchase Details
Closed on
Nov 20, 2009
Sold by
Beneficial Mortgage Co
Bought by
Ameen Shadid and Shahid Ailia
Current Estimated Value
Home Financials for this Owner
Home Financials are based on the most recent Mortgage that was taken out on this home.
Original Mortgage
$140,000
Outstanding Balance
$90,758
Interest Rate
4.86%
Estimated Equity
$367,922
Purchase Details
Closed on
Aug 3, 2009
Sold by
Hajnistron Frank
Bought by
Beneficial Mtg
Purchase Details
Closed on
Jan 28, 1999
Sold by
Ferraro Rose M
Bought by
Hajaistron Frank
Home Financials for this Owner
Home Financials are based on the most recent Mortgage that was taken out on this home.
Original Mortgage
$122,400
Interest Rate
6.67%
Create a Home Valuation Report for This Property
The Home Valuation Report is an in-depth analysis detailing your home's value as well as a comparison with similar homes in the area
Home Values in the Area
Average Home Value in this Area
Purchase History
| Date | Buyer | Sale Price | Title Company |
|---|---|---|---|
| Ameen Shadid | $242,000 | -- | |
| Beneficial Mtg | -- | -- | |
| Hajaistron Frank | $136,000 | -- |
Source: Public Records
Mortgage History
| Date | Status | Borrower | Loan Amount |
|---|---|---|---|
| Open | Hajaistron Frank | $140,000 | |
| Previous Owner | Hajaistron Frank | $319,998 | |
| Previous Owner | Hajaistron Frank | $216,700 | |
| Previous Owner | Hajaistron Frank | $122,400 |
Source: Public Records
Tax History
| Year | Tax Paid | Tax Assessment Tax Assessment Total Assessment is a certain percentage of the fair market value that is determined by local assessors to be the total taxable value of land and additions on the property. | Land | Improvement |
|---|---|---|---|---|
| 2025 | $8,049 | $273,210 | $79,800 | $193,410 |
| 2024 | $6,844 | $197,580 | $79,810 | $117,770 |
| 2023 | $6,451 | $197,580 | $79,810 | $117,770 |
| 2022 | $6,068 | $197,580 | $79,810 | $117,770 |
| 2021 | $4,766 | $197,580 | $79,810 | $117,770 |
| 2020 | $4,419 | $197,580 | $79,810 | $117,770 |
| 2019 | $4,419 | $181,090 | $83,440 | $97,650 |
| 2018 | $5,646 | $181,090 | $83,440 | $97,650 |
| 2017 | $4,285 | $181,090 | $83,440 | $97,650 |
| 2016 | $5,529 | $181,090 | $83,440 | $97,650 |
| 2015 | $5,328 | $181,090 | $83,440 | $97,650 |
| 2014 | $5,628 | $200,270 | $91,210 | $109,060 |
Source: Public Records
Map
Nearby Homes
- 24 North Ave
- 101 Pool Rd
- 140 Shawmut Ave
- 197 Maple Ave
- 26 Susan Ln
- 10 Ball Rd
- 71 Leonardo Dr
- 6 Waterbury Rd
- 137 Mulholland Way Unit 83
- 50 Bassett Rd
- 16 Fieldstone Ct
- 63 Sackett Point Rd
- 511 Elm St Unit 3-2
- 500 Elm St Unit 13-6
- 7 Old Forge Rd
- 38 Pine River Rd
- 9 Russell Rd
- 45 Pond Hill Lot 3 Rd
- 44 Upper State St
- 50 Lexington Gardens
Your Personal Tour Guide
Ask me questions while you tour the home.