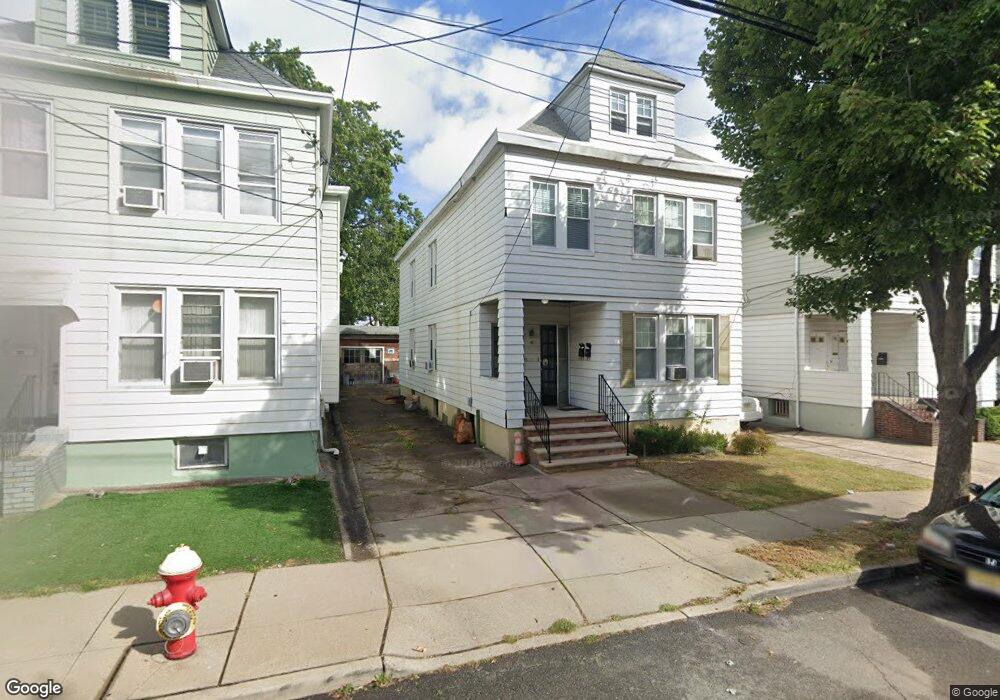
40 Piaget Ave Clifton, NJ 07011
Lakeview NeighborhoodEstimated Value: $606,000 - $698,000
--
Bed
--
Bath
2,188
Sq Ft
$303/Sq Ft
Est. Value
About This Home
This home is located at 40 Piaget Ave, Clifton, NJ 07011 and is currently estimated at $662,766, approximately $302 per square foot. 40 Piaget Ave is a home located in Passaic County with nearby schools including Clifton High School, Classical Academy Charter School of Clifton, and Bright Start Academy.
Ownership History
Date
Name
Owned For
Owner Type
Purchase Details
Closed on
Jul 25, 2022
Sold by
Mikardos Mary Ann
Bought by
Ng Larry and Duong Minh
Current Estimated Value
Purchase Details
Closed on
Sep 3, 2003
Sold by
Mikardos Frances
Bought by
Mikardos Mary and Mikardos Dionisios
Home Financials for this Owner
Home Financials are based on the most recent Mortgage that was taken out on this home.
Original Mortgage
$150,000
Interest Rate
6.22%
Create a Home Valuation Report for This Property
The Home Valuation Report is an in-depth analysis detailing your home's value as well as a comparison with similar homes in the area
Home Values in the Area
Average Home Value in this Area
Purchase History
| Date | Buyer | Sale Price | Title Company |
|---|---|---|---|
| Ng Larry | $490,000 | First American Title | |
| Ng Larry | $490,000 | First American Title | |
| Mikardos Mary | $150,000 | -- |
Source: Public Records
Mortgage History
| Date | Status | Borrower | Loan Amount |
|---|---|---|---|
| Previous Owner | Mikardos Mary | $150,000 |
Source: Public Records
Tax History Compared to Growth
Tax History
| Year | Tax Paid | Tax Assessment Tax Assessment Total Assessment is a certain percentage of the fair market value that is determined by local assessors to be the total taxable value of land and additions on the property. | Land | Improvement |
|---|---|---|---|---|
| 2025 | $10,637 | $179,200 | $71,800 | $107,400 |
| 2024 | $10,383 | $179,200 | $71,800 | $107,400 |
| 2022 | $9,382 | $164,300 | $71,800 | $92,500 |
| 2021 | $8,995 | $164,300 | $71,800 | $92,500 |
| 2020 | $9,025 | $164,300 | $71,800 | $92,500 |
| 2019 | $8,961 | $164,300 | $71,800 | $92,500 |
| 2018 | $8,910 | $164,300 | $71,800 | $92,500 |
| 2017 | $8,813 | $164,300 | $71,800 | $92,500 |
| 2016 | $8,642 | $164,300 | $71,800 | $92,500 |
| 2015 | $8,558 | $164,300 | $71,800 | $92,500 |
| 2014 | $8,383 | $164,300 | $71,800 | $92,500 |
Source: Public Records
Map
Nearby Homes