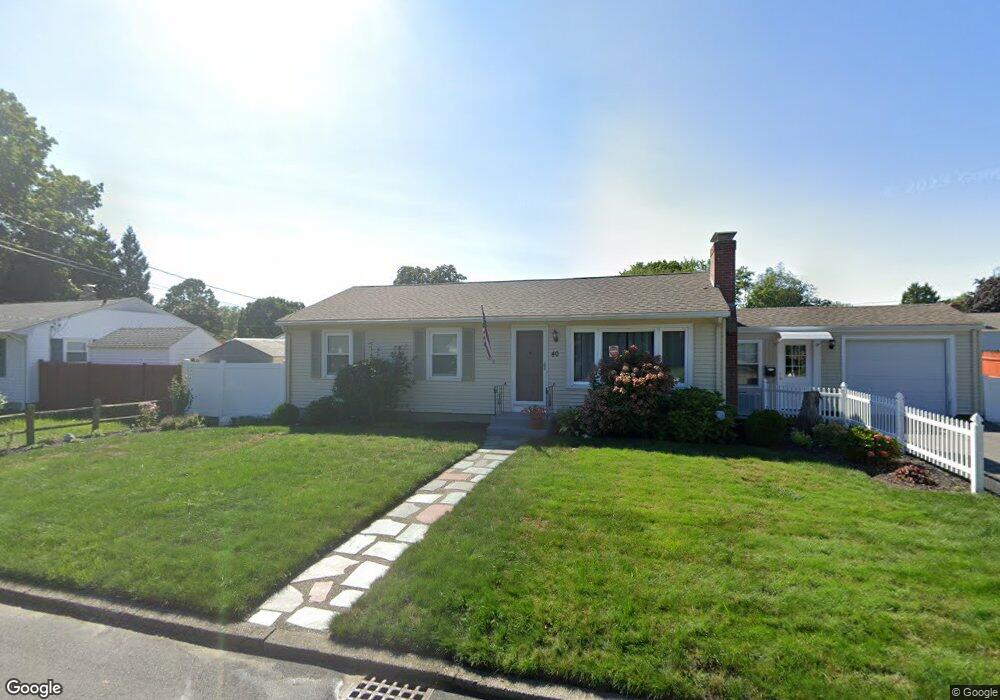
40 Plum Rd Riverside, RI 02915
Riverside NeighborhoodEstimated Value: $449,000 - $465,759
3
Beds
2
Baths
1,368
Sq Ft
$334/Sq Ft
Est. Value
About This Home
This home is located at 40 Plum Rd, Riverside, RI 02915 and is currently estimated at $457,190, approximately $334 per square foot. 40 Plum Rd is a home located in Providence County with nearby schools including East Providence High School, St Luke Elementary School, and St Mary Academy-Bay View.
Ownership History
Date
Name
Owned For
Owner Type
Purchase Details
Closed on
Aug 19, 2011
Sold by
Godek Edward F
Bought by
Godek Edward F and Jemio Maria Virginia
Current Estimated Value
Home Financials for this Owner
Home Financials are based on the most recent Mortgage that was taken out on this home.
Original Mortgage
$152,000
Outstanding Balance
$104,571
Interest Rate
4.51%
Mortgage Type
Purchase Money Mortgage
Estimated Equity
$352,619
Purchase Details
Closed on
Aug 16, 2011
Sold by
Goodwin William E and Goodwin Sandra A
Bought by
Godek Edward F
Home Financials for this Owner
Home Financials are based on the most recent Mortgage that was taken out on this home.
Original Mortgage
$152,000
Outstanding Balance
$104,571
Interest Rate
4.51%
Mortgage Type
Purchase Money Mortgage
Estimated Equity
$352,619
Purchase Details
Closed on
Jun 6, 1997
Sold by
Goodwin Marguerite M
Bought by
Goodwin William E and Goodwin Sandra
Create a Home Valuation Report for This Property
The Home Valuation Report is an in-depth analysis detailing your home's value as well as a comparison with similar homes in the area
Home Values in the Area
Average Home Value in this Area
Purchase History
| Date | Buyer | Sale Price | Title Company |
|---|---|---|---|
| Godek Edward F | -- | -- | |
| Godek Edward F | $190,000 | -- | |
| Goodwin William E | $120,000 | -- |
Source: Public Records
Mortgage History
| Date | Status | Borrower | Loan Amount |
|---|---|---|---|
| Open | Goodwin William E | $25,000 | |
| Open | Goodwin William E | $152,000 | |
| Previous Owner | Goodwin William E | $60,000 |
Source: Public Records
Tax History
| Year | Tax Paid | Tax Assessment Tax Assessment Total Assessment is a certain percentage of the fair market value that is determined by local assessors to be the total taxable value of land and additions on the property. | Land | Improvement |
|---|---|---|---|---|
| 2025 | $5,327 | $407,600 | $126,600 | $281,000 |
| 2024 | $5,201 | $339,300 | $105,500 | $233,800 |
| 2023 | $5,008 | $339,300 | $105,500 | $233,800 |
| 2022 | $4,768 | $218,100 | $60,700 | $157,400 |
| 2021 | $4,689 | $218,100 | $56,900 | $161,200 |
| 2020 | $4,491 | $218,100 | $56,900 | $161,200 |
| 2019 | $4,366 | $218,100 | $56,900 | $161,200 |
| 2018 | $4,356 | $190,400 | $55,200 | $135,200 |
| 2017 | $4,259 | $190,400 | $55,200 | $135,200 |
| 2016 | $4,238 | $190,400 | $55,200 | $135,200 |
| 2015 | $4,014 | $174,900 | $51,100 | $123,800 |
| 2014 | $4,014 | $174,900 | $51,100 | $123,800 |
Source: Public Records
Map
Nearby Homes
- 38 Meadowcrest Dr
- 49 Forbes St
- 47 Dartmouth Ave
- 103 Burnside Ave
- 14 Benedict St
- 25 Arnold St
- 14 Winthrop St
- 85 Hospital Rd
- 22 Grassy Plain Rd
- 33 Pine St Unit 35
- 43 Bullocks Point Ave Unit 4A
- 79 Sherman St
- 85 Hilton Ave
- 236 Becker Ave
- 25 Bullocks Point Ave Unit 5C
- 33 Bullocks Point Ave Unit 5C
- 6 Fuller Ave
- 15 Claire St
- 6 Hazelton Rd
- 56 Knowlton St
Your Personal Tour Guide
Ask me questions while you tour the home.