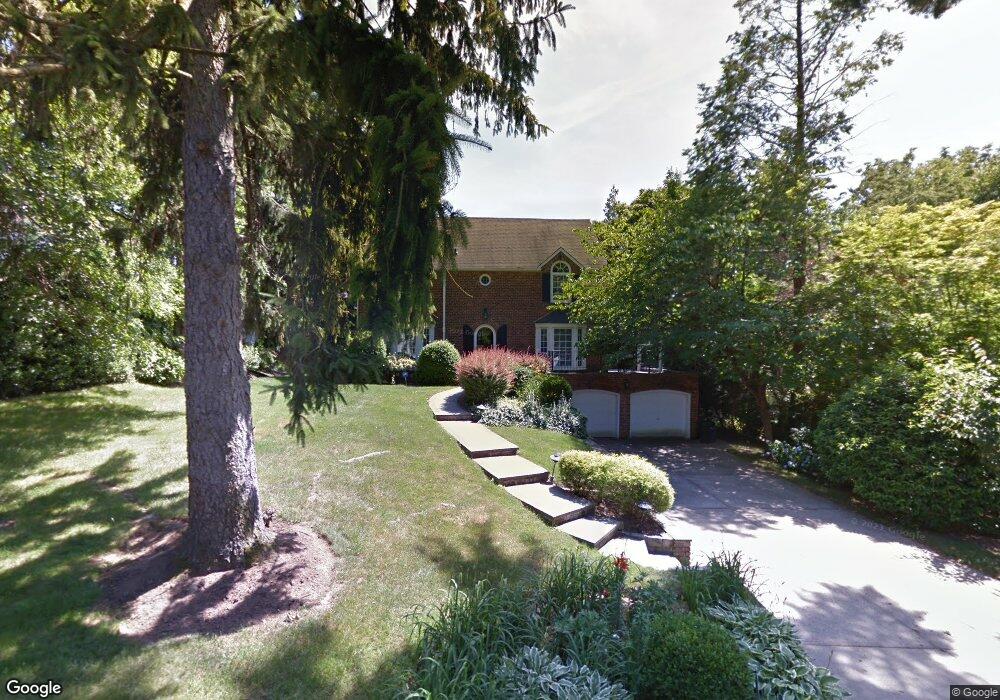
40 Rockcrest Rd Manhasset, NY 11030
Estimated Value: $1,931,247 - $2,154,000
3
Beds
3
Baths
1,970
Sq Ft
$1,037/Sq Ft
Est. Value
About This Home
This home is located at 40 Rockcrest Rd, Manhasset, NY 11030 and is currently estimated at $2,042,624, approximately $1,036 per square foot. 40 Rockcrest Rd is a home located in Nassau County with nearby schools including Manhasset Secondary School, St Mary's Elementary School, and Our Lady of Grace Montessori School.
Ownership History
Date
Name
Owned For
Owner Type
Purchase Details
Closed on
Jul 26, 2011
Sold by
Tolentino Thomas and Tolentino Dianne
Bought by
Marett Gregory J and Marett Aimee
Current Estimated Value
Home Financials for this Owner
Home Financials are based on the most recent Mortgage that was taken out on this home.
Original Mortgage
$750,000
Outstanding Balance
$517,836
Interest Rate
4.51%
Mortgage Type
Purchase Money Mortgage
Estimated Equity
$1,524,788
Purchase Details
Closed on
Jul 25, 2008
Sold by
Schmitt Thomas
Bought by
Tolentino Thomas
Purchase Details
Closed on
Jun 23, 2003
Sold by
Panageas Sotirios
Bought by
Schmitt Thomas
Purchase Details
Closed on
Aug 29, 1997
Sold by
Annins Rose M
Bought by
Panageas Sotirio S and Panageas Katherine
Purchase Details
Closed on
May 22, 1995
Sold by
Annis Paul and Annis Rose
Bought by
Annis Rose
Create a Home Valuation Report for This Property
The Home Valuation Report is an in-depth analysis detailing your home's value as well as a comparison with similar homes in the area
Home Values in the Area
Average Home Value in this Area
Purchase History
| Date | Buyer | Sale Price | Title Company |
|---|---|---|---|
| Marett Gregory J | $1,260,000 | -- | |
| Tolentino Thomas | $1,245,000 | -- | |
| Schmitt Thomas | $1,065,000 | -- | |
| Panageas Sotirio S | $520,000 | -- | |
| Annis Rose | -- | -- |
Source: Public Records
Mortgage History
| Date | Status | Borrower | Loan Amount |
|---|---|---|---|
| Open | Marett Gregory J | $750,000 |
Source: Public Records
Tax History Compared to Growth
Tax History
| Year | Tax Paid | Tax Assessment Tax Assessment Total Assessment is a certain percentage of the fair market value that is determined by local assessors to be the total taxable value of land and additions on the property. | Land | Improvement |
|---|---|---|---|---|
| 2025 | $19,030 | $1,170 | $623 | $547 |
| 2024 | $5,873 | $1,180 | $628 | $552 |
| 2023 | $17,279 | $1,305 | $695 | $610 |
| 2022 | $17,279 | $1,330 | $708 | $622 |
| 2021 | $13,707 | $1,455 | $732 | $723 |
| 2020 | $17,229 | $1,863 | $1,862 | $1 |
| 2019 | $17,801 | $1,996 | $1,995 | $1 |
| 2018 | $18,067 | $2,130 | $0 | $0 |
| 2017 | $11,738 | $2,268 | $1,919 | $349 |
| 2016 | $18,903 | $2,268 | $1,919 | $349 |
| 2015 | $7,593 | $2,520 | $2,088 | $432 |
| 2014 | $7,593 | $2,520 | $2,088 | $432 |
| 2013 | $7,224 | $2,520 | $2,088 | $432 |
Source: Public Records
Map
Nearby Homes
- 20 Mill Spring Rd
- 183 Mill Spring Rd
- 207 Mill Spring Rd
- 112 Chapel Rd
- 65 Old Mill Rd
- 414 Hunt Ln
- 10 Soundview Crest
- 53 Stuart Place
- 50 Eakins Rd
- 39 Bluebird Hill Ct
- 44 Old ox Rd
- 45 Bristol Dr
- 60 Thayer Rd
- 23 Estates Terrace N
- 43 Bristol Dr
- 25 The Oaks
- 117 Eagles Crescent
- 39 Hawthorne Place
- 17 Evergreen Cir
- 305 Nassau Ave