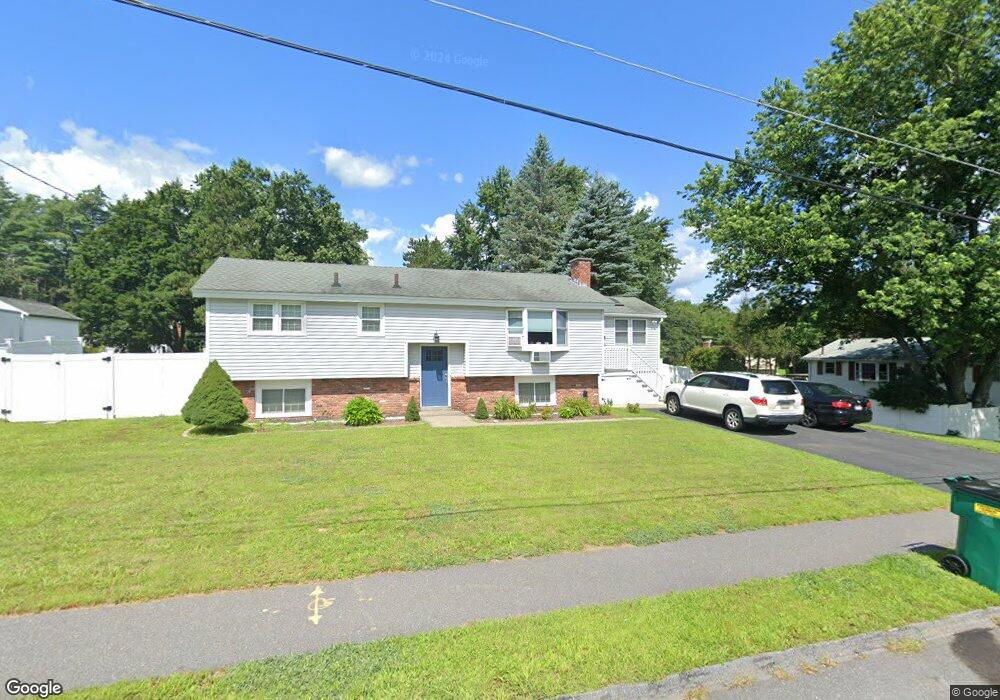
40 Rolling Ln Hudson, MA 01749
Estimated Value: $555,971 - $630,000
3
Beds
1
Bath
1,264
Sq Ft
$470/Sq Ft
Est. Value
About This Home
This home is located at 40 Rolling Ln, Hudson, MA 01749 and is currently estimated at $593,743, approximately $469 per square foot. 40 Rolling Ln is a home located in Middlesex County with nearby schools including David J. Quinn Middle School, Hudson High School, and First Steps Children's Center.
Ownership History
Date
Name
Owned For
Owner Type
Purchase Details
Closed on
Sep 10, 2015
Sold by
Sherman Pamela F and Sherman Dennis H
Bought by
Oliveira Flaviano and Oliveira Diane
Current Estimated Value
Home Financials for this Owner
Home Financials are based on the most recent Mortgage that was taken out on this home.
Original Mortgage
$260,100
Outstanding Balance
$201,039
Interest Rate
4.01%
Mortgage Type
New Conventional
Estimated Equity
$392,704
Purchase Details
Closed on
May 13, 2011
Sold by
Sherman Pamela
Bought by
Sherman Pamela and Sherman Dennis H
Purchase Details
Closed on
Nov 3, 2008
Sold by
Georges Christos
Bought by
Georges Christos
Create a Home Valuation Report for This Property
The Home Valuation Report is an in-depth analysis detailing your home's value as well as a comparison with similar homes in the area
Home Values in the Area
Average Home Value in this Area
Purchase History
We collect this data history from publicly available records. To have your information removed, we recommend requesting removal directly through your county’s website.
| Date | Buyer | Sale Price | Title Company |
|---|---|---|---|
| Oliveira Flaviano | $289,000 | -- | |
| Oliveira Flaviano | $289,000 | -- | |
| Oliveira Flaviano | $289,000 | -- | |
| Sherman Pamela | -- | -- | |
| Sherman Pamela | -- | -- | |
| Sherman Pamela F | -- | -- | |
| Sherman Pamela | -- | -- | |
| Sherman Pamela F | -- | -- | |
| Georges Christos | -- | -- | |
| Georges Christos | -- | -- | |
| Georges Christos | -- | -- |
Source: Public Records
Mortgage History
We collect this data history from publicly available records. To have your information removed, we recommend requesting removal directly through your county’s website.
| Date | Status | Borrower | Loan Amount |
|---|---|---|---|
| Open | Oliveira Flaviano | $260,100 | |
| Closed | Oliveira Flaviano | $260,100 | |
| Previous Owner | Georges Christos | $50,000 |
Source: Public Records
Tax History
| Year | Tax Paid | Tax Assessment Tax Assessment Total Assessment is a certain percentage of the fair market value that is determined by local assessors to be the total taxable value of land and additions on the property. | Land | Improvement |
|---|---|---|---|---|
| 2025 | $7,419 | $534,500 | $174,000 | $360,500 |
| 2024 | $6,941 | $495,800 | $158,300 | $337,500 |
| 2023 | $6,404 | $438,600 | $152,100 | $286,500 |
| 2022 | $5,946 | $374,900 | $138,300 | $236,600 |
| 2021 | $5,564 | $335,400 | $131,700 | $203,700 |
| 2020 | $5,529 | $332,900 | $129,200 | $203,700 |
| 2019 | $5,283 | $310,200 | $129,200 | $181,000 |
| 2018 | $5,007 | $286,100 | $130,800 | $155,300 |
| 2017 | $5,143 | $293,900 | $129,500 | $164,400 |
| 2016 | $4,741 | $274,200 | $129,500 | $144,700 |
| 2015 | $4,364 | $252,700 | $129,500 | $123,200 |
| 2014 | $4,038 | $231,800 | $113,400 | $118,400 |
Source: Public Records
Map
Nearby Homes
- 8 Deer Path Unit 8
- 113 Brigham St Unit 4D
- 111 Brigham St Unit 11B
- 111 Brigham St Unit 19A
- 111 Brigham St Unit 20C
- 167 Gates Pond Rd
- 8 Reardon Rd
- 43 Saint James Cir
- 102 Park St
- 110 River St
- 12 Forbes Rd
- 12 Linden St
- 56 Park St
- 107 Washington St
- 39-41 Green St
- 17 School St Unit A
- 17 School St Unit C
- 140 Matheson Dr
- 39 Brook Ln
- 0 Washington St
Your Personal Tour Guide
Ask me questions while you tour the home.