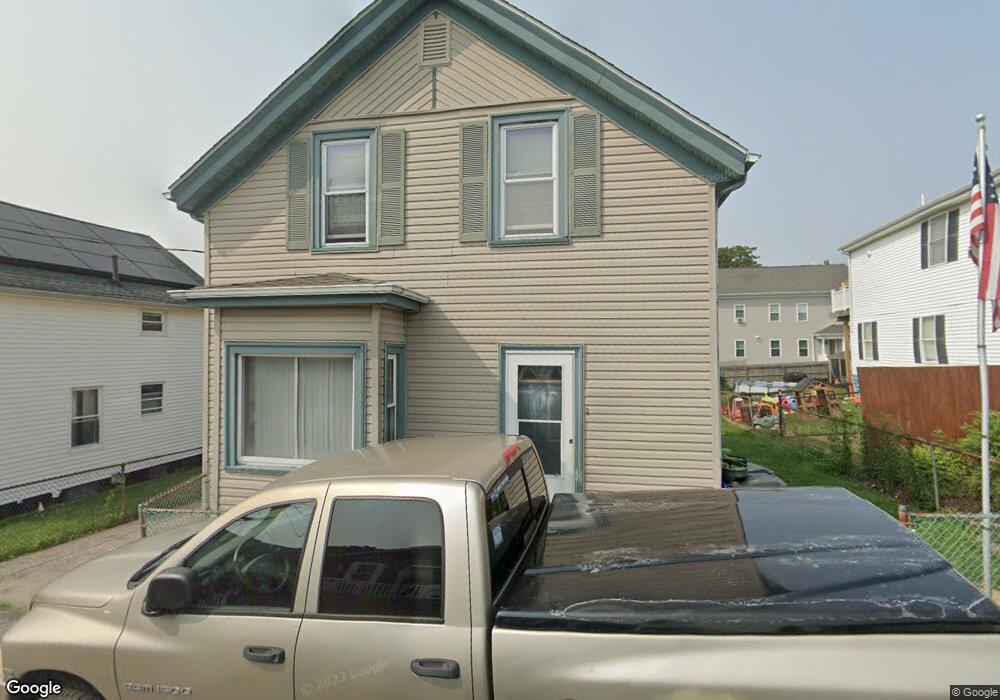
40 Sachem St Fall River, MA 02724
Sandy Beach NeighborhoodEstimated Value: $349,553 - $386,000
3
Beds
1
Bath
908
Sq Ft
$405/Sq Ft
Est. Value
About This Home
This home is located at 40 Sachem St, Fall River, MA 02724 and is currently estimated at $367,638, approximately $404 per square foot. 40 Sachem St is a home located in Bristol County with nearby schools including Carlton M. Viveiros Elementary School, Matthew J. Kuss Middle School, and B M C Durfee High School.
Ownership History
Date
Name
Owned For
Owner Type
Purchase Details
Closed on
Dec 10, 1993
Sold by
Rowe Evelyn M
Bought by
Borges John R and Borges Sandra-Jane A
Current Estimated Value
Home Financials for this Owner
Home Financials are based on the most recent Mortgage that was taken out on this home.
Original Mortgage
$76,500
Interest Rate
6.78%
Mortgage Type
Purchase Money Mortgage
Create a Home Valuation Report for This Property
The Home Valuation Report is an in-depth analysis detailing your home's value as well as a comparison with similar homes in the area
Home Values in the Area
Average Home Value in this Area
Purchase History
| Date | Buyer | Sale Price | Title Company |
|---|---|---|---|
| Borges John R | $75,000 | -- |
Source: Public Records
Mortgage History
| Date | Status | Borrower | Loan Amount |
|---|---|---|---|
| Open | Borges John R | $129,000 | |
| Closed | Borges John R | $128,392 | |
| Closed | Borges John R | $18,000 | |
| Closed | Borges John R | $76,500 |
Source: Public Records
Tax History
| Year | Tax Paid | Tax Assessment Tax Assessment Total Assessment is a certain percentage of the fair market value that is determined by local assessors to be the total taxable value of land and additions on the property. | Land | Improvement |
|---|---|---|---|---|
| 2025 | $2,975 | $259,800 | $105,100 | $154,700 |
| 2024 | $2,805 | $244,100 | $101,200 | $142,900 |
| 2023 | $2,546 | $207,500 | $83,600 | $123,900 |
| 2022 | $2,388 | $189,200 | $79,700 | $109,500 |
| 2021 | $2,252 | $162,800 | $75,800 | $87,000 |
| 2020 | $2,282 | $157,900 | $74,700 | $83,200 |
| 2019 | $2,194 | $150,500 | $71,900 | $78,600 |
| 2018 | $2,126 | $145,400 | $77,900 | $67,500 |
| 2017 | $1,975 | $141,100 | $74,200 | $66,900 |
| 2016 | $1,940 | $142,300 | $79,000 | $63,300 |
| 2015 | $1,895 | $144,900 | $79,000 | $65,900 |
| 2014 | $1,794 | $142,600 | $76,700 | $65,900 |
Source: Public Records
Map
Nearby Homes
- 70 Brown St
- 700 Shore Dr Unit 6-604
- 700 Shore Dr Unit 1205
- 700 Shore Dr Unit 810
- 20 Wilcox St
- 1273-1279 S Main St
- 420 Bradford Ave
- 303 Eagle St Unit C
- 1334 S Main St
- 403 Division St Unit 13
- 403 Division St Unit 5
- 403 Division St Unit 9
- 403 Division St Unit 11
- 403 Division St Unit 12
- 403 Division St Unit 1
- 403 Division St Unit 18
- 334 Fountain St
- 330 William St
- 245 Dwelly St
- 71 Mystic St Unit 3
Your Personal Tour Guide
Ask me questions while you tour the home.