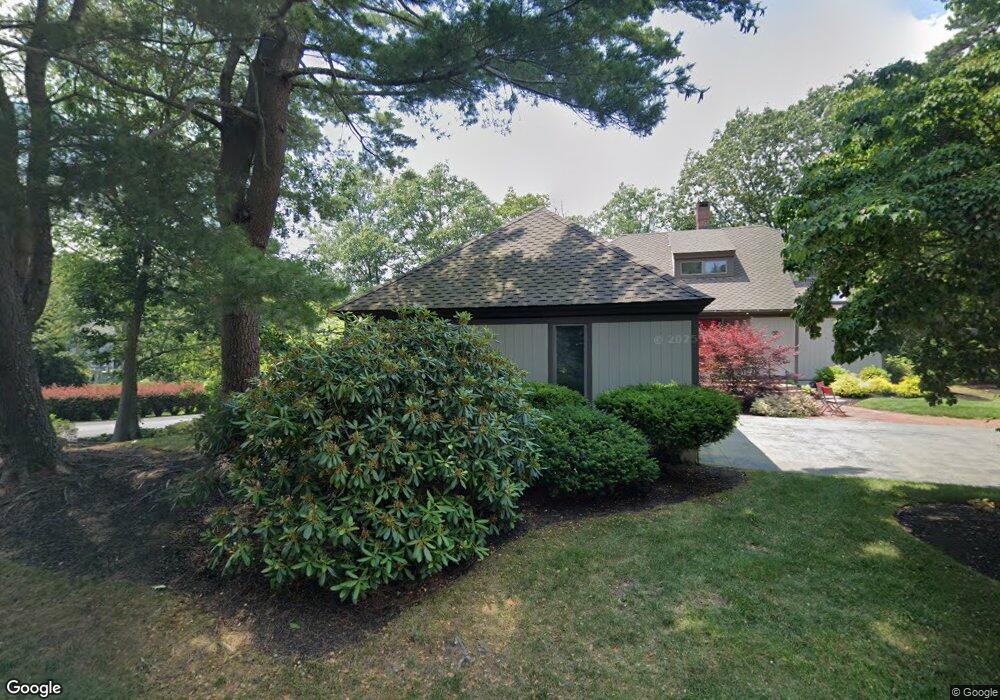
40 Salem St Unit 1 Swampscott, MA 01907
Estimated Value: $1,122,000 - $1,406,000
2
Beds
4
Baths
2,323
Sq Ft
$547/Sq Ft
Est. Value
About This Home
This home is located at 40 Salem St Unit 1, Swampscott, MA 01907 and is currently estimated at $1,271,433, approximately $547 per square foot. 40 Salem St Unit 1 is a home located in Essex County with nearby schools including Swampscott Middle School, Swampscott High School, and Epstein Hillel School.
Ownership History
Date
Name
Owned For
Owner Type
Purchase Details
Closed on
Aug 23, 2017
Sold by
Jade Rt and Cowden
Bought by
Honig Peter G and Roberts Sarah C
Current Estimated Value
Home Financials for this Owner
Home Financials are based on the most recent Mortgage that was taken out on this home.
Original Mortgage
$564,000
Outstanding Balance
$470,382
Interest Rate
4.03%
Mortgage Type
New Conventional
Estimated Equity
$801,052
Purchase Details
Closed on
Jun 6, 2017
Sold by
Cowden Peter W
Bought by
Jade Rt and Cowden
Purchase Details
Closed on
Jun 26, 2013
Sold by
Suzanne Grosz Ft and Grosz
Bought by
Cowden Peter W and Wells Diana M
Home Financials for this Owner
Home Financials are based on the most recent Mortgage that was taken out on this home.
Original Mortgage
$500,000
Interest Rate
3.51%
Mortgage Type
New Conventional
Purchase Details
Closed on
Jul 2, 1996
Sold by
Jelliffe Abbie E and Clark Jelliffe G
Bought by
Grosz Suzanne
Purchase Details
Closed on
Jul 11, 1991
Sold by
Benson Lucille T
Bought by
Jelliffe Jelliffe Abbie E Abbie E and G Clark Jelliffe
Create a Home Valuation Report for This Property
The Home Valuation Report is an in-depth analysis detailing your home's value as well as a comparison with similar homes in the area
Home Values in the Area
Average Home Value in this Area
Purchase History
| Date | Buyer | Sale Price | Title Company |
|---|---|---|---|
| Honig Peter G | $705,000 | -- | |
| Honig Peter G | $705,000 | -- | |
| Jade Rt | -- | -- | |
| Jade Rt | -- | -- | |
| Cowden Peter W | $625,000 | -- | |
| Cowden Peter W | $625,000 | -- | |
| Grosz Suzanne | $400,000 | -- | |
| Grosz Suzanne | $400,000 | -- | |
| Jelliffe Jelliffe Abbie E Abbie E | $360,000 | -- | |
| Jelliffe Abbie E | $360,000 | -- |
Source: Public Records
Mortgage History
| Date | Status | Borrower | Loan Amount |
|---|---|---|---|
| Open | Honig Peter G | $564,000 | |
| Closed | Honig Peter G | $564,000 | |
| Previous Owner | Cowden Peter W | $500,000 |
Source: Public Records
Tax History Compared to Growth
Tax History
| Year | Tax Paid | Tax Assessment Tax Assessment Total Assessment is a certain percentage of the fair market value that is determined by local assessors to be the total taxable value of land and additions on the property. | Land | Improvement |
|---|---|---|---|---|
| 2025 | $13,764 | $1,200,000 | $453,800 | $746,200 |
| 2024 | $13,233 | $1,151,700 | $433,500 | $718,200 |
| 2023 | $12,752 | $1,086,200 | $433,500 | $652,700 |
| 2022 | $10,787 | $840,800 | $284,500 | $556,300 |
| 2021 | $10,391 | $753,000 | $216,700 | $536,300 |
| 2020 | $9,721 | $679,800 | $189,600 | $490,200 |
| 2019 | $10,333 | $679,800 | $189,600 | $490,200 |
| 2018 | $10,877 | $679,800 | $189,600 | $490,200 |
| 2017 | $11,397 | $653,100 | $189,600 | $463,500 |
| 2016 | $11,318 | $653,100 | $189,600 | $463,500 |
| 2015 | $11,619 | $677,500 | $189,600 | $487,900 |
| 2014 | $11,033 | $590,000 | $142,200 | $447,800 |
Source: Public Records
Map
Nearby Homes
- 24 Orchard Cir
- 37 Stanley Rd
- 25 Manton Rd
- 71 Walnut Rd
- 35 Alden Rd
- 1004 Paradise Rd Unit PHJ
- 1006 Paradise Rd Unit 3R
- 48 Bellevue Rd
- 309 Paradise Rd
- 8 Ocean View Rd
- 9 Tedesco Pond Place Unit 9
- 306 Paradise Rd
- 75 Bay View Dr
- 21 Bay View Dr
- 13 Cedar Hill Terrace Unit 2
- 445 Essex St Unit 304
- 2 Wilfred Terrace
- 6 Loring Hills Ave Unit D3
- 10-12 Fairview Ave
- 71 Greenwood Ave Unit 207
- 38 Salem St Unit 1
- 14 Salem St Unit 1
- 37 Salem St Unit 1
- 37 Salem St
- 39 Salem St Unit 1
- 39 Salem St
- 15 One Salem St Unit 15
- 11 One Salem St Unit 11
- 15 Salem St Unit 1
- 11 Salem St Unit 1
- 1 Salem St
- 1 Salem St Unit 13B
- 1 Salem St Unit 29
- 1 Salem St Unit 1
- 1 Salem St Unit 39
- 1 Salem St Unit 30
- 1 Salem St Unit 29
- 1 Salem St Unit 6
- 1 Salem St Unit 7
- 1 Salem St Unit 4