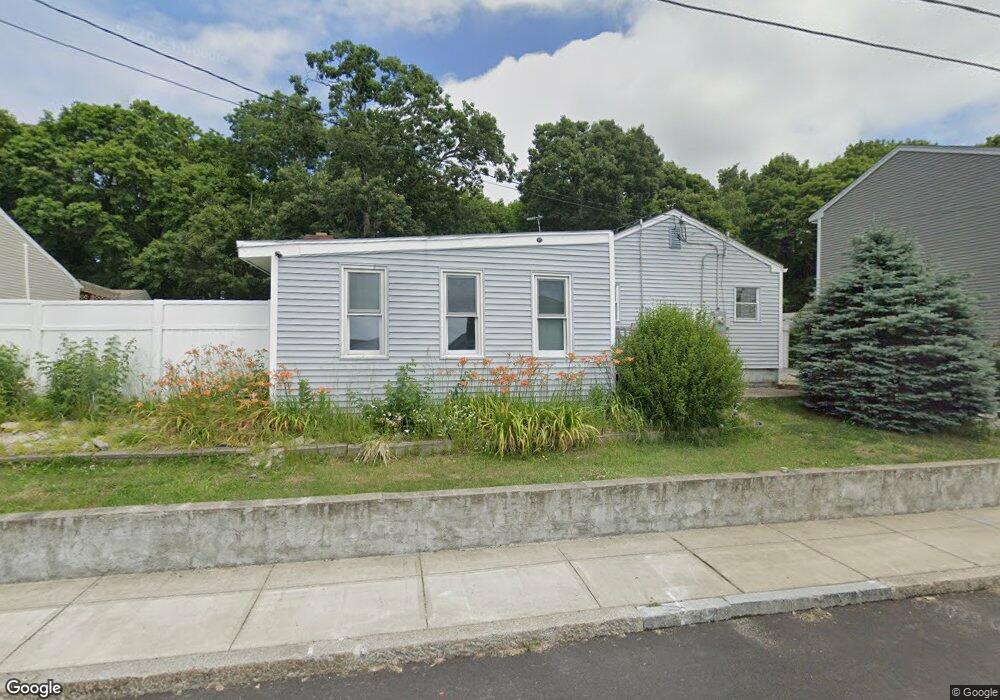
40 Sevigny St Fall River, MA 02723
Bank Street NeighborhoodEstimated Value: $381,000 - $458,000
4
Beds
1
Bath
1,508
Sq Ft
$267/Sq Ft
Est. Value
About This Home
This home is located at 40 Sevigny St, Fall River, MA 02723 and is currently estimated at $402,438, approximately $266 per square foot. 40 Sevigny St is a home located in Bristol County with nearby schools including Mary Fonseca Elementary School, Talbot Innovation School, and B M C Durfee High School.
Ownership History
Date
Name
Owned For
Owner Type
Purchase Details
Closed on
Oct 24, 1989
Sold by
Lake Carol A
Bought by
Quartochi Edward
Current Estimated Value
Home Financials for this Owner
Home Financials are based on the most recent Mortgage that was taken out on this home.
Original Mortgage
$128,000
Interest Rate
10.06%
Mortgage Type
Purchase Money Mortgage
Create a Home Valuation Report for This Property
The Home Valuation Report is an in-depth analysis detailing your home's value as well as a comparison with similar homes in the area
Home Values in the Area
Average Home Value in this Area
Purchase History
| Date | Buyer | Sale Price | Title Company |
|---|---|---|---|
| Quartochi Edward | $160,000 | -- |
Source: Public Records
Mortgage History
| Date | Status | Borrower | Loan Amount |
|---|---|---|---|
| Closed | Quartochi Edward | $128,000 | |
| Previous Owner | Quartochi Edward | $10,000 | |
| Previous Owner | Quartochi Edward | $79,000 |
Source: Public Records
Tax History
| Year | Tax Paid | Tax Assessment Tax Assessment Total Assessment is a certain percentage of the fair market value that is determined by local assessors to be the total taxable value of land and additions on the property. | Land | Improvement |
|---|---|---|---|---|
| 2025 | $3,521 | $307,500 | $129,500 | $178,000 |
| 2024 | $3,293 | $286,600 | $124,600 | $162,000 |
| 2023 | $3,121 | $254,400 | $106,800 | $147,600 |
| 2022 | $2,726 | $216,000 | $97,100 | $118,900 |
| 2021 | $2,601 | $188,100 | $89,900 | $98,200 |
| 2020 | $2,511 | $173,800 | $86,000 | $87,800 |
| 2019 | $2,374 | $162,800 | $81,900 | $80,900 |
| 2018 | $2,268 | $155,100 | $80,400 | $74,700 |
| 2017 | $2,174 | $155,300 | $82,000 | $73,300 |
| 2016 | $2,110 | $154,800 | $85,400 | $69,400 |
| 2015 | $1,984 | $151,700 | $82,300 | $69,400 |
| 2014 | $1,962 | $156,000 | $86,600 | $69,400 |
Source: Public Records
Map
Nearby Homes
- 243 Oak Grove Ave
- 217 Plain St
- 218 Plain St
- 677 Oak Grove Ave
- 992 Pine St
- 84 Healy St
- 869 Bedford St
- 10 Carlisa Dr
- 884 Cherry St
- 273 Tremont St
- 45-47 Shawmut St
- 243 Robeson St Unit 6
- 243 Robeson St Unit 3
- 108 Garden St
- 295 Newbury St
- 742 New Boston Rd
- 168 Windsor St
- 545 Robeson St
- 139 Quarry St
- 105 16th St
Your Personal Tour Guide
Ask me questions while you tour the home.