40 Simmons St Rehoboth, MA 02769
Estimated Value: $398,000 - $603,000
3
Beds
1
Bath
1,090
Sq Ft
$473/Sq Ft
Est. Value
About This Home
This home is located at 40 Simmons St, Rehoboth, MA 02769 and is currently estimated at $515,904, approximately $473 per square foot. 40 Simmons St is a home located in Bristol County with nearby schools including Dighton-Rehoboth Regional High School.
Ownership History
Date
Name
Owned For
Owner Type
Purchase Details
Closed on
Sep 11, 2017
Sold by
Carpenter Miles E and Carpenter Joan E
Bought by
Carpenter Joan E and Carpenter Miles E
Current Estimated Value
Purchase Details
Closed on
Feb 1, 1975
Bought by
Carpenter Miles E and Carpenter Joan E
Create a Home Valuation Report for This Property
The Home Valuation Report is an in-depth analysis detailing your home's value as well as a comparison with similar homes in the area
Home Values in the Area
Average Home Value in this Area
Purchase History
| Date | Buyer | Sale Price | Title Company |
|---|---|---|---|
| Carpenter Joan E | -- | -- | |
| Carpenter Miles E | -- | -- |
Source: Public Records
Mortgage History
| Date | Status | Borrower | Loan Amount |
|---|---|---|---|
| Previous Owner | Carpenter Miles E | $148,700 | |
| Previous Owner | Carpenter Miles E | $168,000 | |
| Previous Owner | Carpenter Miles E | $149,720 | |
| Previous Owner | Carpenter Miles E | $80,000 |
Source: Public Records
Tax History
| Year | Tax Paid | Tax Assessment Tax Assessment Total Assessment is a certain percentage of the fair market value that is determined by local assessors to be the total taxable value of land and additions on the property. | Land | Improvement |
|---|---|---|---|---|
| 2025 | $42 | $372,500 | $183,300 | $189,200 |
| 2024 | $3,946 | $347,400 | $183,300 | $164,100 |
| 2023 | $3,904 | $341,400 | $179,700 | $161,700 |
| 2022 | $3,904 | $308,100 | $179,700 | $128,400 |
| 2021 | $4,054 | $306,200 | $171,900 | $134,300 |
| 2020 | $3,967 | $302,400 | $171,900 | $130,500 |
| 2018 | $3,316 | $277,000 | $164,100 | $112,900 |
| 2017 | $3,321 | $264,400 | $164,100 | $100,300 |
| 2016 | $3,168 | $260,700 | $164,100 | $96,600 |
| 2015 | $3,331 | $270,600 | $156,900 | $113,700 |
| 2014 | $3,192 | $256,600 | $149,700 | $106,900 |
Source: Public Records
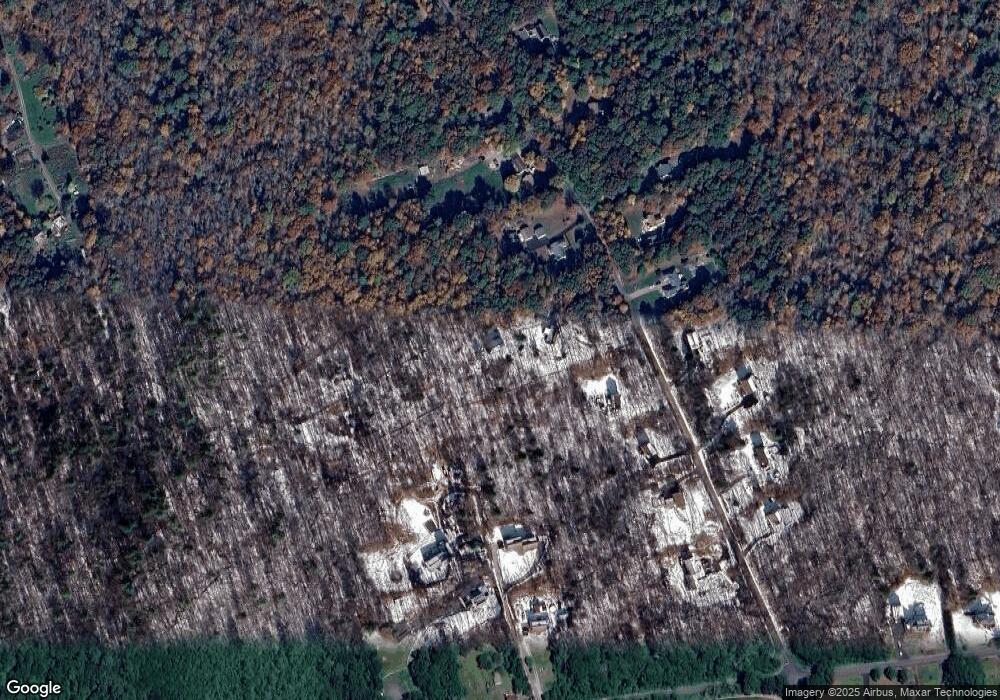
Map
Nearby Homes
- 19 Cedar St Unit 21
- 2188 Cedar St
- 46 Mikayla Ann Dr
- 2713 Horton St
- 185 Moulton St
- 0 Horton St Unit 73333337
- 2625 Lewis St
- 42 Linden Ln
- 8 Linden Ln
- 8 Linden Ln
- 248 County
- 2206 Williams St
- 24 New St
- 2681 Courtlyn Rd
- 0 Wellington St
- 197 Chestnut St
- 67 Martin St
- 75 Martin St
- 23 Bay State Rd
- 16 Martin St
Your Personal Tour Guide
Ask me questions while you tour the home.