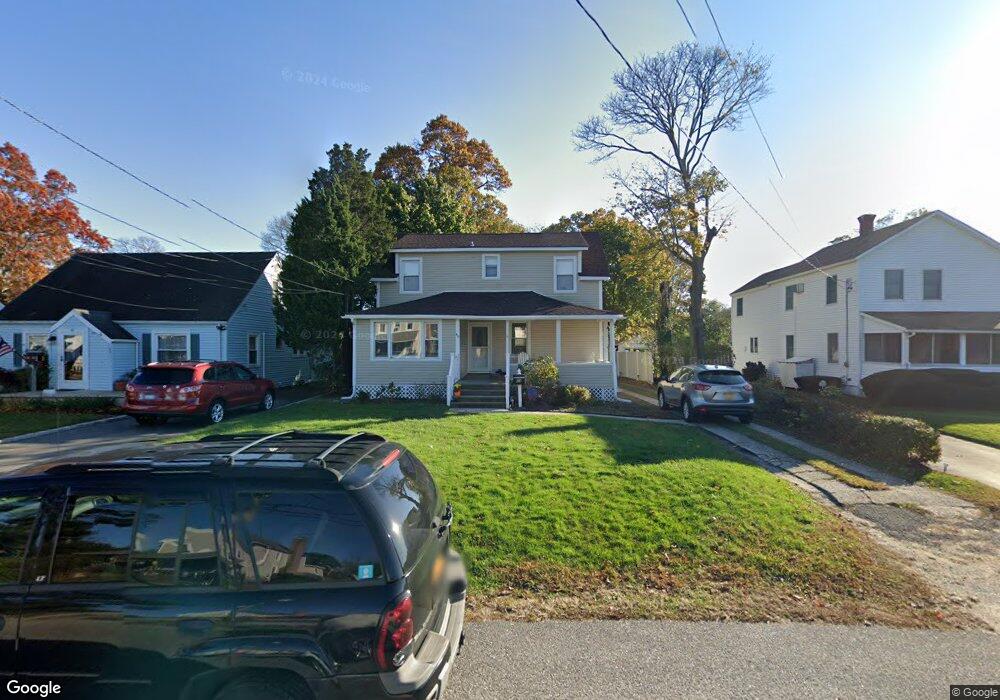
40 Terrell St Patchogue, NY 11772
Estimated Value: $555,754 - $630,000
4
Beds
2
Baths
1,688
Sq Ft
$355/Sq Ft
Est. Value
About This Home
This home is located at 40 Terrell St, Patchogue, NY 11772 and is currently estimated at $599,189, approximately $354 per square foot. 40 Terrell St is a home located in Suffolk County with nearby schools including Patchogue-Medford High School, Holy Angels Regional School, and Victory Christian Academy.
Ownership History
Date
Name
Owned For
Owner Type
Purchase Details
Closed on
Jan 4, 2016
Sold by
Real Onion Llc
Bought by
Bertuch Catherine and Bertuch Gerard
Current Estimated Value
Home Financials for this Owner
Home Financials are based on the most recent Mortgage that was taken out on this home.
Original Mortgage
$294,566
Outstanding Balance
$236,472
Interest Rate
4.25%
Mortgage Type
FHA
Estimated Equity
$362,717
Purchase Details
Closed on
Dec 27, 2014
Sold by
Sappe Esq David and Ortiz Patricia
Bought by
Real Onion Llc
Purchase Details
Closed on
Oct 10, 2007
Sold by
Ortiz Patricia
Bought by
Ortiz Patricia
Purchase Details
Closed on
Mar 30, 2007
Purchase Details
Closed on
Feb 9, 2007
Sold by
Garbarini Stephen
Bought by
Ortiz Patricia
Purchase Details
Closed on
May 3, 1999
Sold by
Garbarini Laurel
Bought by
Garbarini Stephen
Create a Home Valuation Report for This Property
The Home Valuation Report is an in-depth analysis detailing your home's value as well as a comparison with similar homes in the area
Home Values in the Area
Average Home Value in this Area
Purchase History
| Date | Buyer | Sale Price | Title Company |
|---|---|---|---|
| Bertuch Catherine | $300,000 | None Available | |
| Real Onion Llc | $157,951 | None Available | |
| Ortiz Patricia | $254,000 | -- | |
| -- | $254,000 | -- | |
| Ortiz Patricia | $254,000 | Vincent Alaimo | |
| Garbarini Stephen | -- | Commonwealth Land Title Ins |
Source: Public Records
Mortgage History
| Date | Status | Borrower | Loan Amount |
|---|---|---|---|
| Open | Bertuch Catherine | $294,566 | |
| Closed | Real Onion Llc | $0 |
Source: Public Records
Tax History
| Year | Tax Paid | Tax Assessment Tax Assessment Total Assessment is a certain percentage of the fair market value that is determined by local assessors to be the total taxable value of land and additions on the property. | Land | Improvement |
|---|---|---|---|---|
| 2024 | $6,718 | $1,500 | $300 | $1,200 |
| 2023 | $6,718 | $1,500 | $300 | $1,200 |
| 2022 | $6,098 | $1,500 | $300 | $1,200 |
| 2021 | $6,098 | $1,500 | $300 | $1,200 |
| 2020 | $6,256 | $1,500 | $300 | $1,200 |
| 2019 | $6,256 | $0 | $0 | $0 |
| 2018 | $5,165 | $1,500 | $300 | $1,200 |
| 2017 | $5,165 | $1,300 | $300 | $1,000 |
| 2016 | $5,049 | $1,300 | $300 | $1,000 |
| 2015 | -- | $1,300 | $300 | $1,000 |
| 2014 | -- | $1,300 | $300 | $1,000 |
Source: Public Records
Map
Nearby Homes
Your Personal Tour Guide
Ask me questions while you tour the home.