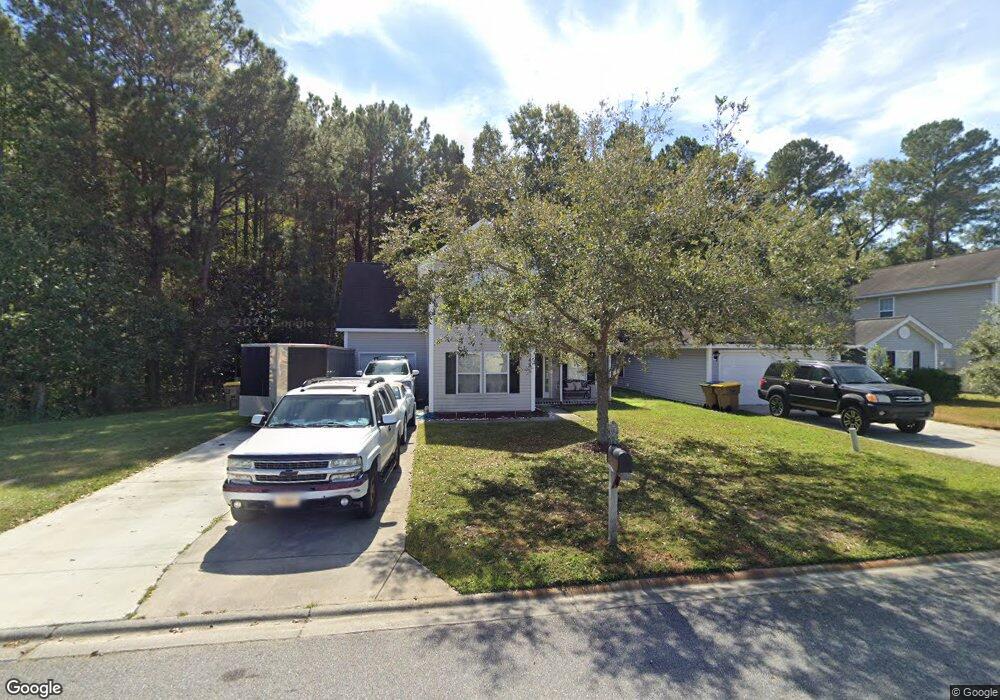
40 Tiller Way Savannah, GA 31407
Estimated Value: $269,000 - $285,832
3
Beds
2
Baths
1,669
Sq Ft
$165/Sq Ft
Est. Value
About This Home
This home is located at 40 Tiller Way, Savannah, GA 31407 and is currently estimated at $275,958, approximately $165 per square foot. 40 Tiller Way is a home located in Chatham County with nearby schools including Rice Creek K-8 School and Groves High School.
Ownership History
Date
Name
Owned For
Owner Type
Purchase Details
Closed on
Aug 10, 2016
Bought by
Blige Danielle
Current Estimated Value
Home Financials for this Owner
Home Financials are based on the most recent Mortgage that was taken out on this home.
Original Mortgage
$111,443
Outstanding Balance
$88,398
Interest Rate
3.3%
Mortgage Type
FHA
Estimated Equity
$187,560
Purchase Details
Closed on
Feb 2, 2016
Sold by
Wells Fargo Bank Na
Bought by
Secretary Of Veterans Affairs
Purchase Details
Closed on
Sep 28, 2012
Sold by
Chancey Jordan Alan
Bought by
Gawlak Ronald and Gawlak Crystal D
Home Financials for this Owner
Home Financials are based on the most recent Mortgage that was taken out on this home.
Original Mortgage
$137,800
Interest Rate
3.64%
Mortgage Type
VA
Purchase Details
Closed on
Dec 31, 2008
Sold by
Not Provided
Bought by
Chancey Jordan Alan
Create a Home Valuation Report for This Property
The Home Valuation Report is an in-depth analysis detailing your home's value as well as a comparison with similar homes in the area
Home Values in the Area
Average Home Value in this Area
Purchase History
| Date | Buyer | Sale Price | Title Company |
|---|---|---|---|
| Blige Danielle | $113,500 | -- | |
| Secretary Of Veterans Affairs | $91,854 | -- | |
| Wells Fargo Bank Na | -- | -- | |
| Gawlak Ronald | $134,900 | -- | |
| Chancey Jordan Alan | $129,055 | -- |
Source: Public Records
Mortgage History
| Date | Status | Borrower | Loan Amount |
|---|---|---|---|
| Open | Blige Danielle | $111,443 | |
| Previous Owner | Gawlak Ronald | $137,800 |
Source: Public Records
Tax History Compared to Growth
Tax History
| Year | Tax Paid | Tax Assessment Tax Assessment Total Assessment is a certain percentage of the fair market value that is determined by local assessors to be the total taxable value of land and additions on the property. | Land | Improvement |
|---|---|---|---|---|
| 2025 | $3,626 | $111,520 | $20,000 | $91,520 |
| 2024 | $3,626 | $99,760 | $18,000 | $81,760 |
| 2023 | $3,001 | $92,880 | $18,000 | $74,880 |
| 2022 | $2,216 | $75,560 | $8,000 | $67,560 |
| 2021 | $2,221 | $65,480 | $8,000 | $57,480 |
| 2020 | $1,955 | $63,720 | $8,000 | $55,720 |
| 2019 | $1,955 | $56,520 | $8,000 | $48,520 |
| 2018 | $1,911 | $54,600 | $8,000 | $46,600 |
| 2017 | $1,794 | $54,800 | $8,000 | $46,800 |
| 2016 | $1,534 | $46,840 | $8,000 | $38,840 |
| 2015 | $1,552 | $47,320 | $8,000 | $39,320 |
| 2014 | $2,203 | $45,760 | $0 | $0 |
Source: Public Records
Map
Nearby Homes
- 7 Corsair Cir
- 24 Transom Rd
- 32 Transom Rd
- 15 Newport Blvd
- 26 Halyard Dr
- 58 Bearing Cir Unit B
- 56 Bearing Cir
- 33 Gimbal Cir
- 19 Halyard Dr
- 10 Binnacle Ln
- 11 Cordage Cir
- 629 & 631 Meinhard Rd
- 1 Braxton Manor Dr
- 217 Monteith Rd
- Lot 6 Raley Rd
- Lot 5 Raley Rd
- 44 Braxton Manor Dr
- 42 Braxton Manor Dr
- 150 Berrien Rd
- 15 Amber Dr