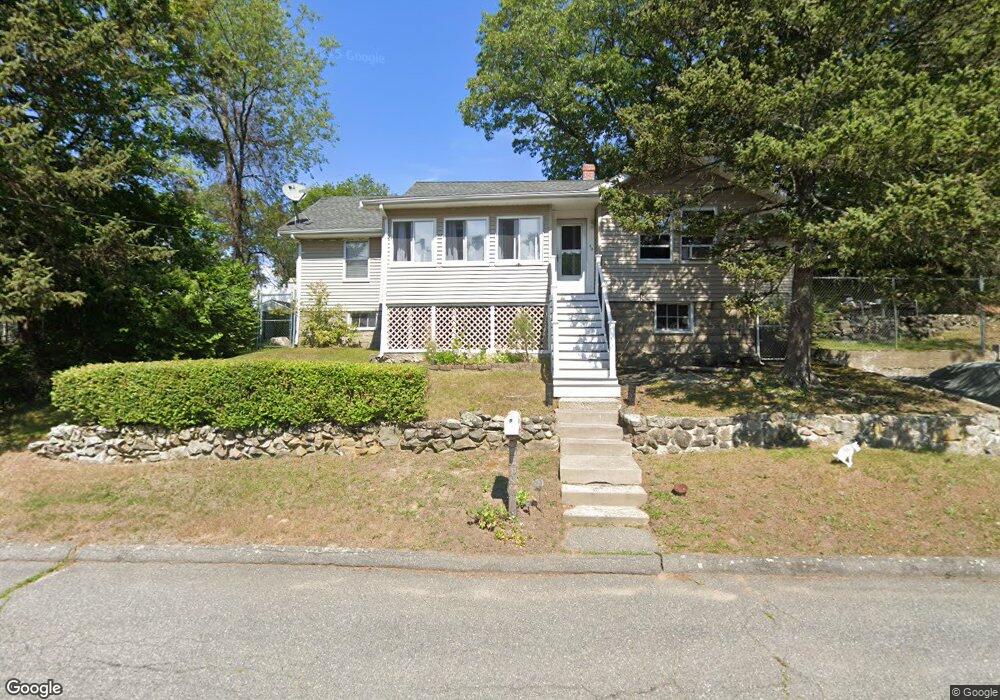
40 Tontaquon Ave Saugus, MA 01906
Downtown Saugus NeighborhoodEstimated Value: $541,000 - $602,164
2
Beds
1
Bath
1,112
Sq Ft
$514/Sq Ft
Est. Value
About This Home
This home is located at 40 Tontaquon Ave, Saugus, MA 01906 and is currently estimated at $572,041, approximately $514 per square foot. 40 Tontaquon Ave is a home located in Essex County with nearby schools including Saugus High School, Pioneer Charter School Of Science II, and Sacred Heart School.
Ownership History
Date
Name
Owned For
Owner Type
Purchase Details
Closed on
Dec 16, 2008
Sold by
Res Funding Re Hold
Bought by
Clarke Andrew
Current Estimated Value
Purchase Details
Closed on
Mar 17, 2008
Sold by
Amero Thomas B and Amero Joelle
Bought by
Res Funding Co Llc
Purchase Details
Closed on
Nov 25, 1998
Sold by
Belliveau David R and Belliveau Marjorie A
Bought by
Amero Thomas B and Amero Joelle
Create a Home Valuation Report for This Property
The Home Valuation Report is an in-depth analysis detailing your home's value as well as a comparison with similar homes in the area
Home Values in the Area
Average Home Value in this Area
Purchase History
| Date | Buyer | Sale Price | Title Company |
|---|---|---|---|
| Clarke Andrew | $189,000 | -- | |
| Res Funding Re Hold | -- | -- | |
| Res Funding Co Llc | $252,000 | -- | |
| Amero Thomas B | $162,500 | -- |
Source: Public Records
Mortgage History
| Date | Status | Borrower | Loan Amount |
|---|---|---|---|
| Open | Amero Thomas B | $179,000 |
Source: Public Records
Tax History Compared to Growth
Tax History
| Year | Tax Paid | Tax Assessment Tax Assessment Total Assessment is a certain percentage of the fair market value that is determined by local assessors to be the total taxable value of land and additions on the property. | Land | Improvement |
|---|---|---|---|---|
| 2025 | $5,651 | $529,100 | $313,200 | $215,900 |
| 2024 | $5,409 | $507,900 | $295,300 | $212,600 |
| 2023 | $5,239 | $465,300 | $259,500 | $205,800 |
| 2022 | $5,066 | $421,800 | $238,000 | $183,800 |
| 2021 | $4,819 | $390,500 | $206,700 | $183,800 |
| 2020 | $4,453 | $373,600 | $196,900 | $176,700 |
| 2019 | $4,251 | $349,000 | $179,000 | $170,000 |
| 2018 | $3,875 | $334,600 | $173,600 | $161,000 |
| 2017 | $3,510 | $291,300 | $162,000 | $129,300 |
| 2016 | $3,243 | $265,800 | $161,700 | $104,100 |
| 2015 | $3,043 | $253,200 | $154,000 | $99,200 |
| 2014 | $3,008 | $259,100 | $154,000 | $105,100 |
Source: Public Records
Map
Nearby Homes