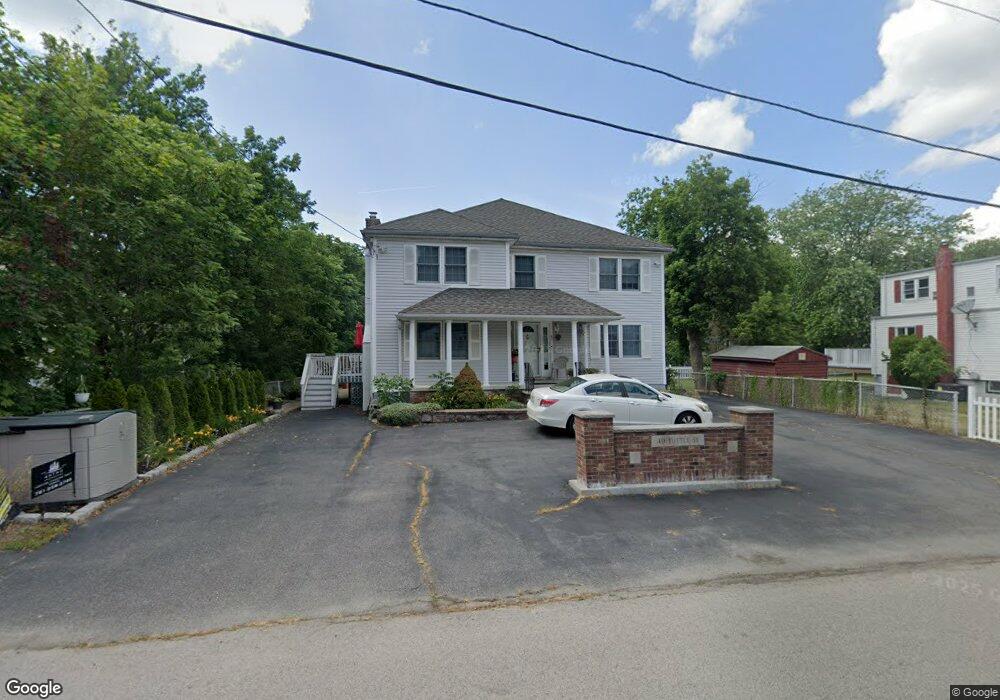
40 Tuttle St Saugus, MA 01906
Pleasant Hills NeighborhoodEstimated Value: $910,000 - $1,057,000
5
Beds
4
Baths
3,000
Sq Ft
$322/Sq Ft
Est. Value
About This Home
This home is located at 40 Tuttle St, Saugus, MA 01906 and is currently estimated at $966,465, approximately $322 per square foot. 40 Tuttle St is a home located in Essex County with nearby schools including Saugus High School, Pioneer Charter School Of Science II, and Melrose Montessori School.
Ownership History
Date
Name
Owned For
Owner Type
Purchase Details
Closed on
Jun 25, 2024
Sold by
Mitrano Debra M and Mitrano Theodore L
Bought by
40 Tuttle Street Rt and Mitrano
Current Estimated Value
Purchase Details
Closed on
Mar 23, 1984
Bought by
Mitrano Theodore L and Mitrano Debra M
Create a Home Valuation Report for This Property
The Home Valuation Report is an in-depth analysis detailing your home's value as well as a comparison with similar homes in the area
Home Values in the Area
Average Home Value in this Area
Purchase History
| Date | Buyer | Sale Price | Title Company |
|---|---|---|---|
| 40 Tuttle Street Rt | -- | None Available | |
| 40 Tuttle Street Rt | -- | None Available | |
| Mitrano Theodore L | -- | -- |
Source: Public Records
Mortgage History
| Date | Status | Borrower | Loan Amount |
|---|---|---|---|
| Previous Owner | Mitrano Theodore L | $50,000 | |
| Previous Owner | Mitrano Theodore L | $50,000 | |
| Previous Owner | Mitrano Theodore L | $72,000 | |
| Previous Owner | Mitrano Theodore L | $10,000 |
Source: Public Records
Tax History
| Year | Tax Paid | Tax Assessment Tax Assessment Total Assessment is a certain percentage of the fair market value that is determined by local assessors to be the total taxable value of land and additions on the property. | Land | Improvement |
|---|---|---|---|---|
| 2025 | $9,088 | $850,900 | $316,200 | $534,700 |
| 2024 | $8,745 | $821,100 | $298,200 | $522,900 |
| 2023 | $8,401 | $746,100 | $262,000 | $484,100 |
| 2022 | $7,677 | $639,200 | $240,300 | $398,900 |
| 2021 | $7,498 | $607,600 | $208,700 | $398,900 |
| 2020 | $6,968 | $584,600 | $198,800 | $385,800 |
| 2019 | $6,669 | $547,500 | $180,700 | $366,800 |
| 2018 | $6,214 | $536,600 | $175,300 | $361,300 |
| 2017 | $5,967 | $495,200 | $163,500 | $331,700 |
| 2016 | $5,583 | $457,600 | $163,300 | $294,300 |
| 2015 | $5,238 | $435,800 | $155,500 | $280,300 |
| 2014 | $5,078 | $437,400 | $155,500 | $281,900 |
Source: Public Records
Map
Nearby Homes
- 141 Essex St Unit D6
- 141 Essex St Unit B4
- 20 Maple St
- 57 Vine St
- 7 Adams Ave
- 31 Mountain Ave
- 32-34 Mount Vernon St
- 62 Main St
- 4 Foss Ave
- 25 Auburn St
- 36 Jasper St
- 12B Cheever Ave
- 12C Cheever Ave
- 2 Ashford St
- 6 Saugus Ave Unit A
- 133 Salem St Unit 414
- 52 Hesper St
- 82 Elwell St
- 67 Saville St
- 36 Central Ave
Your Personal Tour Guide
Ask me questions while you tour the home.