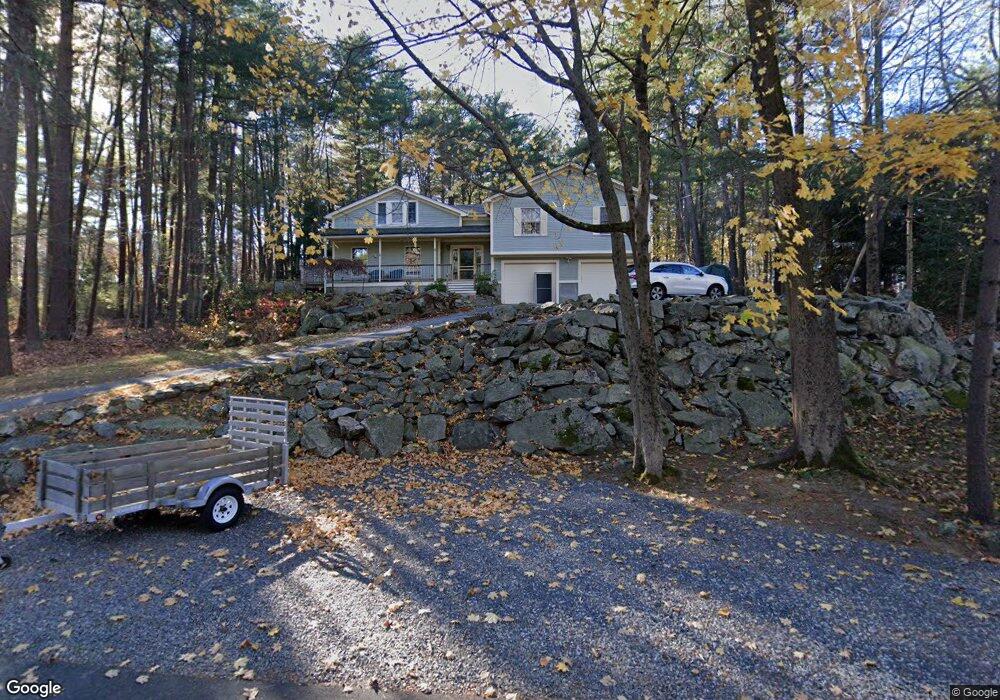
40 Walker Bungalow Rd Portsmouth, NH 03801
Estimated Value: $1,559,000 - $2,262,000
5
Beds
4
Baths
3,186
Sq Ft
$586/Sq Ft
Est. Value
About This Home
This home is located at 40 Walker Bungalow Rd, Portsmouth, NH 03801 and is currently estimated at $1,868,041, approximately $586 per square foot. 40 Walker Bungalow Rd is a home located in Rockingham County with nearby schools including Little Harbour School, Portsmouth Middle School, and Portsmouth High School.
Ownership History
Date
Name
Owned For
Owner Type
Purchase Details
Closed on
Jul 9, 2024
Sold by
William J Becker 2007 Ret and Becker
Bought by
Hayes Richard S and Hayes Jessica F
Current Estimated Value
Purchase Details
Closed on
Jun 12, 2019
Sold by
Dintino Carmine
Bought by
Hayes Richad S and Hayes Jessica F
Home Financials for this Owner
Home Financials are based on the most recent Mortgage that was taken out on this home.
Original Mortgage
$680,000
Interest Rate
4.1%
Mortgage Type
Purchase Money Mortgage
Purchase Details
Closed on
May 10, 2012
Sold by
Logon-Dintine Ann
Bought by
Dintine Carmine
Purchase Details
Closed on
Sep 28, 1999
Sold by
Traversy Gary and Traversy Karen
Bought by
Dintino Carmine J
Home Financials for this Owner
Home Financials are based on the most recent Mortgage that was taken out on this home.
Original Mortgage
$212,500
Interest Rate
8.1%
Create a Home Valuation Report for This Property
The Home Valuation Report is an in-depth analysis detailing your home's value as well as a comparison with similar homes in the area
Home Values in the Area
Average Home Value in this Area
Purchase History
| Date | Buyer | Sale Price | Title Company |
|---|---|---|---|
| Hayes Richard S | -- | None Available | |
| Hayes Richard S | -- | None Available | |
| Hayes Richad S | $850,000 | -- | |
| Hayes Richad S | $850,000 | -- | |
| Dintine Carmine | -- | -- | |
| Dintino Carmine J | $250,000 | -- | |
| Dintine Carmine | -- | -- | |
| Dintino Carmine J | $250,000 | -- |
Source: Public Records
Mortgage History
| Date | Status | Borrower | Loan Amount |
|---|---|---|---|
| Previous Owner | Hayes Richad S | $680,000 | |
| Previous Owner | Dintino Carmine J | $212,500 |
Source: Public Records
Tax History Compared to Growth
Tax History
| Year | Tax Paid | Tax Assessment Tax Assessment Total Assessment is a certain percentage of the fair market value that is determined by local assessors to be the total taxable value of land and additions on the property. | Land | Improvement |
|---|---|---|---|---|
| 2024 | $15,833 | $1,416,200 | $831,000 | $585,200 |
| 2023 | $12,941 | $802,300 | $372,300 | $430,000 |
| 2022 | $12,195 | $802,300 | $372,300 | $430,000 |
| 2021 | $12,059 | $802,300 | $372,300 | $430,000 |
| 2020 | $11,794 | $802,300 | $372,300 | $430,000 |
| 2019 | $11,913 | $801,700 | $372,300 | $429,400 |
| 2018 | $10,298 | $650,100 | $338,200 | $311,900 |
| 2017 | $9,999 | $650,100 | $338,200 | $311,900 |
| 2016 | $9,471 | $555,800 | $285,400 | $270,400 |
| 2015 | $9,332 | $555,800 | $285,400 | $270,400 |
| 2014 | $8,675 | $479,300 | $253,900 | $225,400 |
| 2013 | $8,584 | $479,300 | $253,900 | $225,400 |
| 2012 | $8,364 | $476,600 | $253,900 | $222,700 |
Source: Public Records
Map
Nearby Homes
- 137 Walker Bungalow Rd
- 149 Jones Ave
- 219 Sagamore Ave
- 1 Sagamore Grove
- 1155 Sagamore Ave Unit 2
- 1155 Sagamore Ave Unit 3
- 1155 Sagamore Ave Unit D
- 1155 Sagamore Ave Unit 1
- 210 South St
- 6 Rockaway St
- 161 Wibird St
- 253 Odiorne Point Rd
- 112 Wentworth Rd
- 4 Sagamore Rd
- 34 Highland St
- 97 Middle Rd
- 14 Sagamore Rd Unit 3
- 320 Thaxter Rd
- 21 Madison St
- 325 Marcy St
- 26 Walker Bungalow Rd
- 58 Walker Bungalow Rd
- 16 Walker Bungalow Rd
- 72 Walker Bungalow Rd
- 546 Sagamore Ave
- 520 Sagamore Ave
- 3 Little Harbor Rd
- 0 Walker Bungalow Rd Unit 4479580
- 488 Sagamore Ave
- 75 Walker Bungalow Rd
- 1 Little Harbor Rd
- 576 Sagamore Ave
- 1 Curriers Cove
- 86 Walker Bungalow Rd
- 594 Sagamore Ave
- 93 Walker Bungalow Rd
- 567 Sagamore Ave Unit 144
- 567 Sagamore Ave Unit 143
- 567 Sagamore Ave Unit 142
- 567 Sagamore Ave Unit 141