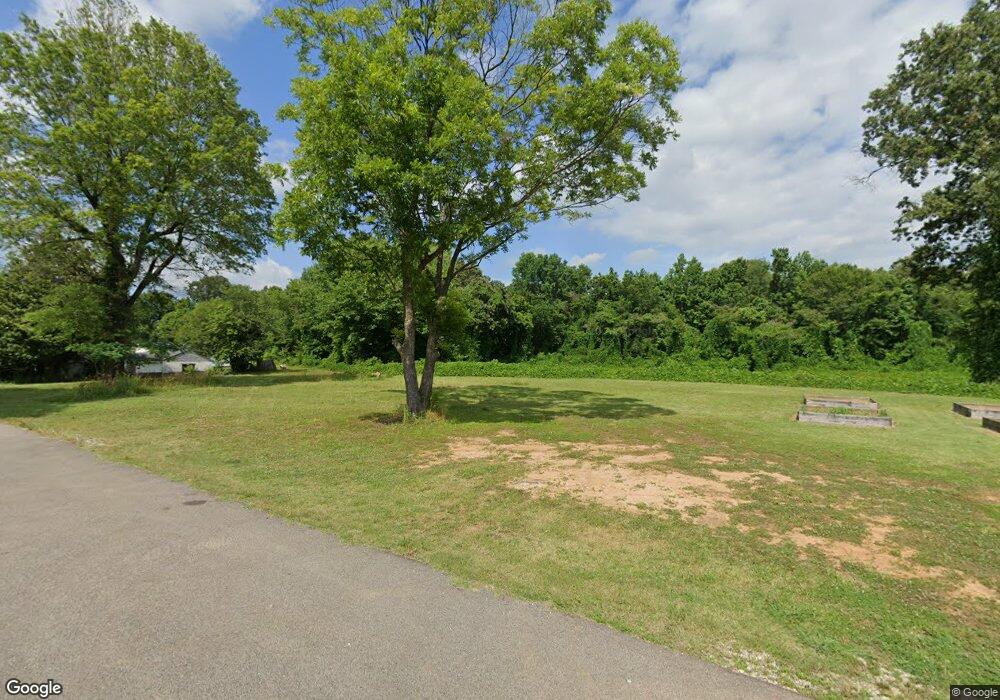
40 Webb St Jackson, TN 38301
Estimated Value: $31,000 - $104,000
2
Beds
1
Bath
970
Sq Ft
$68/Sq Ft
Est. Value
About This Home
This home is located at 40 Webb St, Jackson, TN 38301 and is currently estimated at $66,333, approximately $68 per square foot. 40 Webb St is a home located in Madison County with nearby schools including Isaac Lane Technology Magnet Elementary School and Liberty Technology Magnet High School.
Ownership History
Date
Name
Owned For
Owner Type
Purchase Details
Closed on
Feb 3, 2012
Sold by
Phillips Sonny
Bought by
East Jackson Church Of Chris and O Elders C
Current Estimated Value
Purchase Details
Closed on
Jan 31, 2012
Sold by
Secretary Of Housing And U
Bought by
East Jackson Church Of Chris
Purchase Details
Closed on
Aug 31, 2011
Bought by
Sec Of Housing & Urban Dev
Purchase Details
Closed on
Aug 30, 2011
Sold by
Tennessee Housing Developm
Bought by
Secretary Of Housing And Urban
Purchase Details
Closed on
May 10, 2011
Sold by
Frazier Cynthia J
Bought by
Tennessee Housing Development
Purchase Details
Closed on
May 6, 1998
Bought by
Frazier Cynthia
Purchase Details
Closed on
Jul 14, 1987
Bought by
Harston Johnny C
Purchase Details
Closed on
Sep 28, 1957
Purchase Details
Closed on
Mar 27, 1956
Create a Home Valuation Report for This Property
The Home Valuation Report is an in-depth analysis detailing your home's value as well as a comparison with similar homes in the area
Purchase History
| Date | Buyer | Sale Price | Title Company |
|---|---|---|---|
| East Jackson Church Of Chris | -- | -- | |
| East Jackson Church Of Chris | $10,000 | -- | |
| Sec Of Housing & Urban Dev | $31,200 | -- | |
| Secretary Of Housing And Urban | $31,217 | -- | |
| Tennessee Housing Development | $31,217 | -- | |
| Frazier Cynthia | $37,000 | -- | |
| Harston Johnny C | $22,700 | -- | |
| -- | -- | -- | |
| -- | -- | -- |
Source: Public Records
Tax History
| Year | Tax Paid | Tax Assessment Tax Assessment Total Assessment is a certain percentage of the fair market value that is determined by local assessors to be the total taxable value of land and additions on the property. | Land | Improvement |
|---|---|---|---|---|
| 2025 | $33 | $1,775 | $1,775 | -- |
| 2024 | $33 | $1,775 | $1,775 | -- |
| 2022 | $62 | $1,775 | $1,775 | $0 |
| 2021 | $84 | $1,950 | $1,950 | $0 |
| 2020 | $84 | $1,950 | $1,950 | $0 |
| 2019 | $84 | $1,950 | $1,950 | $0 |
| 2018 | $84 | $1,950 | $1,950 | $0 |
| 2017 | $86 | $1,950 | $1,950 | $0 |
| 2016 | $80 | $1,950 | $1,950 | $0 |
| 2015 | $80 | $1,950 | $1,950 | $0 |
| 2014 | $80 | $1,950 | $1,950 | $0 |
Source: Public Records
Map
Nearby Homes
- 102 Rhea St
- 112 Holland Ave
- 108 Liddon St
- 1404 E Chester St
- 134 Liddon St Unit 136
- 159 Cartmell St
- 105 Griffin St
- 286 Hillcrest Circle Dr
- 599 E Chester St
- 118 Peabody Ave
- 48 Regency Dr
- 210 Peabody Ave
- 213 Ash St
- 220 Ash St
- 73 Craig St
- 126 Barham St
- 0 Cottonwood St
- 123 Lenoir Ave
- 1763 E Chester St
- 219 Walker Ave
