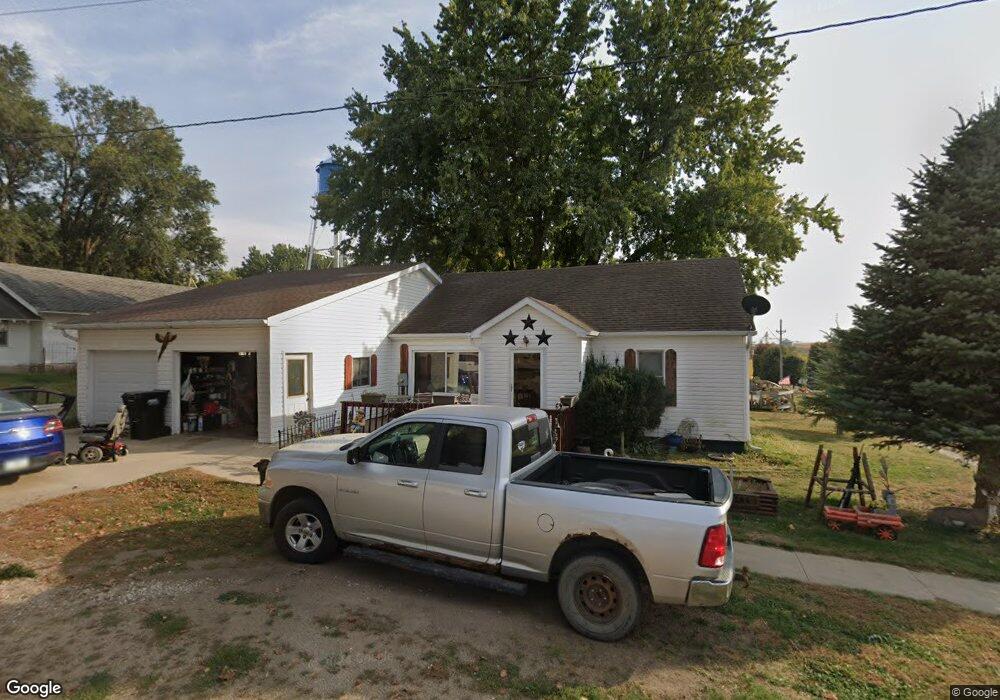
400 4th St Pierson, IA 51048
Estimated Value: $83,000 - $133,132
2
Beds
2
Baths
1,051
Sq Ft
$98/Sq Ft
Est. Value
About This Home
This home is located at 400 4th St, Pierson, IA 51048 and is currently estimated at $102,533, approximately $97 per square foot. 400 4th St is a home located in Woodbury County with nearby schools including Pierson Elementary School, Pierson Middle School, and Kingsley-Pierson High School.
Ownership History
Date
Name
Owned For
Owner Type
Purchase Details
Closed on
Nov 23, 2005
Sold by
Seablom Luke
Bought by
Eldridge Randall J
Current Estimated Value
Home Financials for this Owner
Home Financials are based on the most recent Mortgage that was taken out on this home.
Original Mortgage
$54,975
Interest Rate
6.13%
Mortgage Type
New Conventional
Purchase Details
Closed on
Mar 4, 2000
Sold by
Eloridge Randall J and Eloridge Wendy R
Bought by
Countrywide Home Loans Inc
Create a Home Valuation Report for This Property
The Home Valuation Report is an in-depth analysis detailing your home's value as well as a comparison with similar homes in the area
Home Values in the Area
Average Home Value in this Area
Purchase History
| Date | Buyer | Sale Price | Title Company |
|---|---|---|---|
| Eldridge Randall J | $56,000 | None Available | |
| Countrywide Home Loans Inc | $68,147 | -- |
Source: Public Records
Mortgage History
| Date | Status | Borrower | Loan Amount |
|---|---|---|---|
| Previous Owner | Eldridge Randall J | $54,975 |
Source: Public Records
Tax History Compared to Growth
Tax History
| Year | Tax Paid | Tax Assessment Tax Assessment Total Assessment is a certain percentage of the fair market value that is determined by local assessors to be the total taxable value of land and additions on the property. | Land | Improvement |
|---|---|---|---|---|
| 2025 | $1,756 | $86,820 | $3,280 | $83,540 |
| 2024 | $1,756 | $98,310 | $3,280 | $95,030 |
| 2023 | $1,652 | $98,310 | $3,280 | $95,030 |
| 2022 | $1,626 | $78,110 | $3,280 | $74,830 |
| 2021 | $1,626 | $78,110 | $3,280 | $74,830 |
| 2020 | $1,550 | $72,380 | $3,510 | $68,870 |
| 2019 | $1,490 | $72,380 | $3,510 | $68,870 |
| 2018 | $1,536 | $67,460 | $3,510 | $63,950 |
| 2017 | $1,536 | $67,460 | $3,510 | $63,950 |
| 2016 | $1,550 | $67,460 | $0 | $0 |
| 2015 | $1,467 | $63,050 | $3,280 | $59,770 |
| 2014 | $1,468 | $63,050 | $3,280 | $59,770 |
Source: Public Records
Map
Nearby Homes