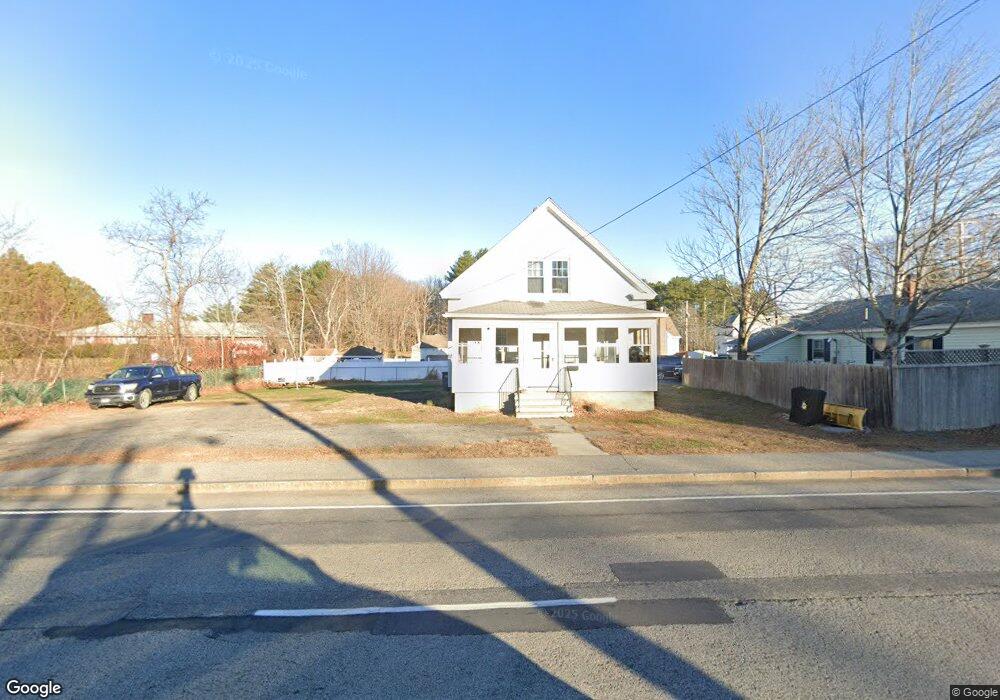
400 Alfred St Biddeford, ME 04005
Estimated Value: $352,000 - $405,000
3
Beds
1
Bath
1,217
Sq Ft
$311/Sq Ft
Est. Value
About This Home
This home is located at 400 Alfred St, Biddeford, ME 04005 and is currently estimated at $378,479, approximately $310 per square foot. 400 Alfred St is a home located in York County with nearby schools including John F Kennedy Memorial School, Biddeford Primary School, and Biddeford Intermediate School.
Ownership History
Date
Name
Owned For
Owner Type
Purchase Details
Closed on
Jan 2, 2020
Sold by
Belanger Paul R and Belanger Paulette N
Bought by
Thibodeau Carol A and Thibodeau James R
Current Estimated Value
Home Financials for this Owner
Home Financials are based on the most recent Mortgage that was taken out on this home.
Original Mortgage
$81,000
Outstanding Balance
$71,567
Interest Rate
3.6%
Mortgage Type
New Conventional
Estimated Equity
$306,912
Create a Home Valuation Report for This Property
The Home Valuation Report is an in-depth analysis detailing your home's value as well as a comparison with similar homes in the area
Home Values in the Area
Average Home Value in this Area
Purchase History
| Date | Buyer | Sale Price | Title Company |
|---|---|---|---|
| Thibodeau Carol A | -- | None Available | |
| Thibodeau Carol A | -- | None Available |
Source: Public Records
Mortgage History
| Date | Status | Borrower | Loan Amount |
|---|---|---|---|
| Open | Thibodeau Carol A | $81,000 | |
| Closed | Thibodeau Carol A | $81,000 |
Source: Public Records
Tax History Compared to Growth
Tax History
| Year | Tax Paid | Tax Assessment Tax Assessment Total Assessment is a certain percentage of the fair market value that is determined by local assessors to be the total taxable value of land and additions on the property. | Land | Improvement |
|---|---|---|---|---|
| 2024 | $2,841 | $199,800 | $117,000 | $82,800 |
| 2023 | $2,621 | $199,800 | $117,000 | $82,800 |
| 2022 | $2,501 | $152,400 | $50,500 | $101,900 |
| 2021 | $2,344 | $128,600 | $42,000 | $86,600 |
| 2020 | $2,560 | $127,700 | $47,500 | $80,200 |
| 2019 | $2,559 | $128,100 | $47,900 | $80,200 |
| 2018 | $3,254 | $128,100 | $47,900 | $80,200 |
| 2017 | $4,232 | $121,800 | $47,900 | $73,900 |
| 2016 | $2,419 | $121,800 | $47,900 | $73,900 |
| 2015 | $2,371 | $121,800 | $47,900 | $73,900 |
| 2014 | $2,313 | $121,800 | $47,900 | $73,900 |
| 2013 | -- | $140,000 | $54,200 | $85,800 |
Source: Public Records
Map
Nearby Homes