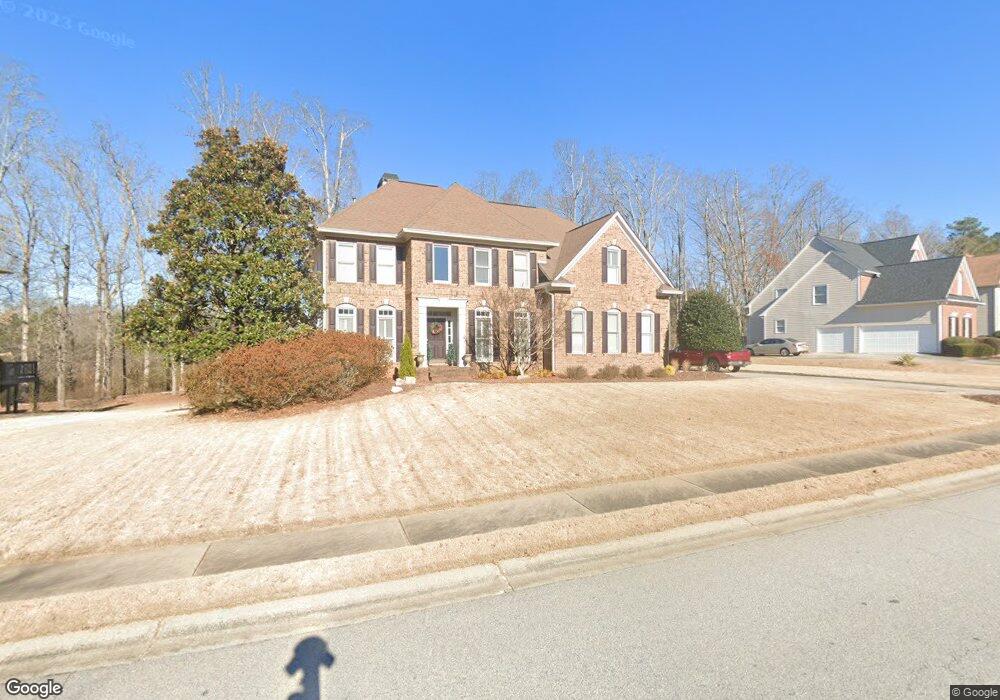
400 Carriage Oaks Dr Tyrone, GA 30290
Estimated Value: $578,000 - $702,000
5
Beds
4
Baths
3,882
Sq Ft
$163/Sq Ft
Est. Value
About This Home
This home is located at 400 Carriage Oaks Dr, Tyrone, GA 30290 and is currently estimated at $634,289, approximately $163 per square foot. 400 Carriage Oaks Dr is a home located in Fayette County with nearby schools including Robert J. Burch Elementary School, Flat Rock Middle School, and Sandy Creek High School.
Ownership History
Date
Name
Owned For
Owner Type
Purchase Details
Closed on
May 15, 2018
Sold by
Sauer Richard C
Bought by
Little Stacy A and Little Dorinda R
Current Estimated Value
Home Financials for this Owner
Home Financials are based on the most recent Mortgage that was taken out on this home.
Original Mortgage
$316,350
Outstanding Balance
$272,388
Interest Rate
4.4%
Mortgage Type
New Conventional
Estimated Equity
$361,901
Purchase Details
Closed on
Jun 30, 2003
Sold by
Butka Edward G
Bought by
Sauer Rick and Sauer Rhonda
Home Financials for this Owner
Home Financials are based on the most recent Mortgage that was taken out on this home.
Original Mortgage
$35,200
Interest Rate
5.16%
Mortgage Type
Unknown
Purchase Details
Closed on
Sep 20, 2002
Sold by
John Wieland Homes
Bought by
Butka Edward G
Home Financials for this Owner
Home Financials are based on the most recent Mortgage that was taken out on this home.
Original Mortgage
$279,300
Interest Rate
5.98%
Create a Home Valuation Report for This Property
The Home Valuation Report is an in-depth analysis detailing your home's value as well as a comparison with similar homes in the area
Home Values in the Area
Average Home Value in this Area
Purchase History
| Date | Buyer | Sale Price | Title Company |
|---|---|---|---|
| Little Stacy A | $333,000 | -- | |
| Sauer Rick | $352,000 | -- | |
| Butka Edward G | $349,300 | -- |
Source: Public Records
Mortgage History
| Date | Status | Borrower | Loan Amount |
|---|---|---|---|
| Open | Little Stacy A | $316,350 | |
| Previous Owner | Sauer Rick | $35,200 | |
| Previous Owner | Sauer Rick | $281,600 | |
| Previous Owner | Butka Edward G | $279,300 |
Source: Public Records
Tax History Compared to Growth
Tax History
| Year | Tax Paid | Tax Assessment Tax Assessment Total Assessment is a certain percentage of the fair market value that is determined by local assessors to be the total taxable value of land and additions on the property. | Land | Improvement |
|---|---|---|---|---|
| 2024 | $4,799 | $214,156 | $32,000 | $182,156 |
| 2023 | $4,104 | $185,480 | $32,000 | $153,480 |
| 2022 | $4,425 | $179,160 | $32,000 | $147,160 |
| 2021 | $4,006 | $144,520 | $24,000 | $120,520 |
| 2020 | $4,190 | $136,680 | $24,000 | $112,680 |
| 2019 | $4,006 | $129,520 | $24,000 | $105,520 |
| 2018 | $3,726 | $116,920 | $24,000 | $92,920 |
| 2017 | $3,878 | $121,240 | $24,000 | $97,240 |
| 2016 | $3,213 | $100,960 | $14,400 | $86,560 |
| 2015 | $2,981 | $92,360 | $14,400 | $77,960 |
| 2014 | $2,884 | $87,960 | $14,400 | $73,560 |
| 2013 | -- | $86,680 | $0 | $0 |
Source: Public Records
Map
Nearby Homes
- 125 Westmont Way
- 101 Westmont Way
- 131 Lincoln Rd
- 125 Meadowview Cir
- 110 Calypso Ct
- 0 Georgia 74
- 105 Delamere Place
- 325 Park Haven Ln
- 91 Goodlin Rd
- 0 Erwin Run Unit 10585589
- 242 Kirkley Rd
- 180 Park Haven Ln
- 238 Kirkley Rd
- 6688 Jules Trace
- 365 Pendleton Trail
- 475 Castlewood Rd
- 6671 Jules Trc
- 8829 Seneca Rd
- 500 Laurelwood Dr
- 170 Brennan Dr
- 402 Carriage Oaks Dr
- 320 Carriage Oaks Dr Unit 155
- 320 Carriage Oaks Dr
- 100 Green Branch Dr
- 318 Carriage Oaks Dr
- 403 Carriage Oaks Dr
- 404 Carriage Oaks Dr
- 101 Green Branch Dr
- 405 Carriage Oaks Dr
- 325 Carriage Oaks Dr
- 102 Green Branch Dr
- 406 Carriage Oaks Dr
- 316 Carriage Oaks Dr
- 407 Carriage Oaks Dr
- 103 Green Branch Dr
- 323 Carriage Oaks Dr
- 104 Green Branch Dr
- 408 Carriage Oaks Dr
- 314 Carriage Oaks Dr
- 105 Green Branch Dr