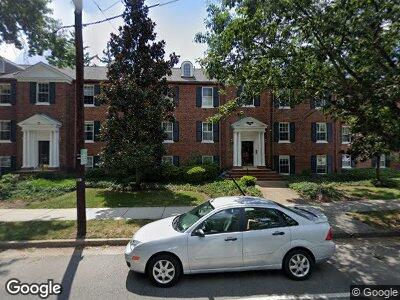
400 Commonwealth Ave Unit 104 Alexandria, VA 22301
Rosemont NeighborhoodEstimated Value: $401,000 - $433,000
1
Bed
1
Bath
765
Sq Ft
$547/Sq Ft
Est. Value
About This Home
This home is located at 400 Commonwealth Ave Unit 104, Alexandria, VA 22301 and is currently estimated at $418,307, approximately $546 per square foot. 400 Commonwealth Ave Unit 104 is a home located in Alexandria City with nearby schools including Naomi L. Brooks Elementary School, George Washington Middle School, and Alexandria City High School.
Ownership History
Date
Name
Owned For
Owner Type
Purchase Details
Closed on
May 25, 2018
Sold by
Stewart Katherine F
Bought by
Askew Megan
Current Estimated Value
Home Financials for this Owner
Home Financials are based on the most recent Mortgage that was taken out on this home.
Original Mortgage
$305,550
Interest Rate
4.4%
Mortgage Type
New Conventional
Purchase Details
Closed on
Jun 20, 2007
Sold by
Squires James
Bought by
Stewart Katherine
Home Financials for this Owner
Home Financials are based on the most recent Mortgage that was taken out on this home.
Original Mortgage
$259,920
Interest Rate
6.25%
Mortgage Type
New Conventional
Purchase Details
Closed on
Sep 16, 2005
Sold by
Domar Partners L L C
Bought by
Squires James G
Home Financials for this Owner
Home Financials are based on the most recent Mortgage that was taken out on this home.
Original Mortgage
$264,800
Interest Rate
5.92%
Mortgage Type
New Conventional
Create a Home Valuation Report for This Property
The Home Valuation Report is an in-depth analysis detailing your home's value as well as a comparison with similar homes in the area
Home Values in the Area
Average Home Value in this Area
Purchase History
| Date | Buyer | Sale Price | Title Company |
|---|---|---|---|
| Askew Megan | $315,000 | Republic Title Inc | |
| Stewart Katherine | $324,000 | -- | |
| Squires James G | $331,000 | -- |
Source: Public Records
Mortgage History
| Date | Status | Borrower | Loan Amount |
|---|---|---|---|
| Open | Askew Megan | $30,000 | |
| Open | Askew Megan | $302,000 | |
| Closed | Askew Megan | $305,550 | |
| Previous Owner | Box Katherine S | $252,000 | |
| Previous Owner | Stewart Katherine F | $259,920 | |
| Previous Owner | Squires James G | $264,800 |
Source: Public Records
Tax History Compared to Growth
Tax History
| Year | Tax Paid | Tax Assessment Tax Assessment Total Assessment is a certain percentage of the fair market value that is determined by local assessors to be the total taxable value of land and additions on the property. | Land | Improvement |
|---|---|---|---|---|
| 2024 | $4,012 | $345,695 | $158,042 | $187,653 |
| 2023 | $3,837 | $345,695 | $158,042 | $187,653 |
| 2022 | $3,680 | $331,543 | $152,220 | $179,323 |
| 2021 | $3,680 | $331,543 | $152,220 | $179,323 |
| 2020 | $3,696 | $331,543 | $152,220 | $179,323 |
| 2019 | $3,568 | $315,756 | $144,972 | $170,784 |
| 2018 | $3,498 | $309,563 | $142,128 | $167,435 |
| 2017 | $3,498 | $309,563 | $142,128 | $167,435 |
| 2016 | $3,163 | $294,822 | $135,360 | $159,462 |
| 2015 | $3,271 | $313,641 | $144,000 | $169,641 |
| 2014 | $3,271 | $313,641 | $144,000 | $169,641 |
Source: Public Records
Map
Nearby Homes
- 400 Commonwealth Ave Unit 303
- 13 W Masonic View Ave
- 120 W Maple St
- 53 Mount Vernon Ave
- 23 Mount Vernon Ave
- 15 W Spring St
- 110 E Spring St
- 437 Earl St
- 1005 Ramsey St
- 514 Colecroft Ct
- 414 Rucker Place
- 545 E Braddock Rd Unit 601
- 545 E Braddock Rd Unit 608
- 505 E Braddock Rd Unit 706
- 505 E Braddock Rd Unit 204
- 1401 Princess St
- 610 N West St Unit 401
- 605 Hilltop Terrace
- 409 N West St
- 303 N West St
- 400 Commonwealth Ave Unit 301
- 400 Commonwealth Ave Unit 107
- 400 Commonwealth Ave Unit 104
- 400 Commonwealth Ave Unit 102
- 400 Commonwealth Ave Unit 307
- 400 Commonwealth Ave Unit 207
- 400 Commonwealth Ave Unit 101
- 400 Commonwealth Ave Unit 103
- 400 Commonwealth Ave Unit 202
- 400 Commonwealth Ave Unit 203
- 400 Commonwealth Ave Unit 304
- 400 Commonwealth Ave Unit 204
- 400 Commonwealth Ave Unit 308
- 400 Commonwealth Ave Unit 305
- 400 Commonwealth Ave Unit 302
- 400 Commonwealth Ave Unit 206
- 400 Commonwealth Ave Unit 205
- 400 Commonwealth Ave Unit 201
- 400 Commonwealth Ave Unit 108