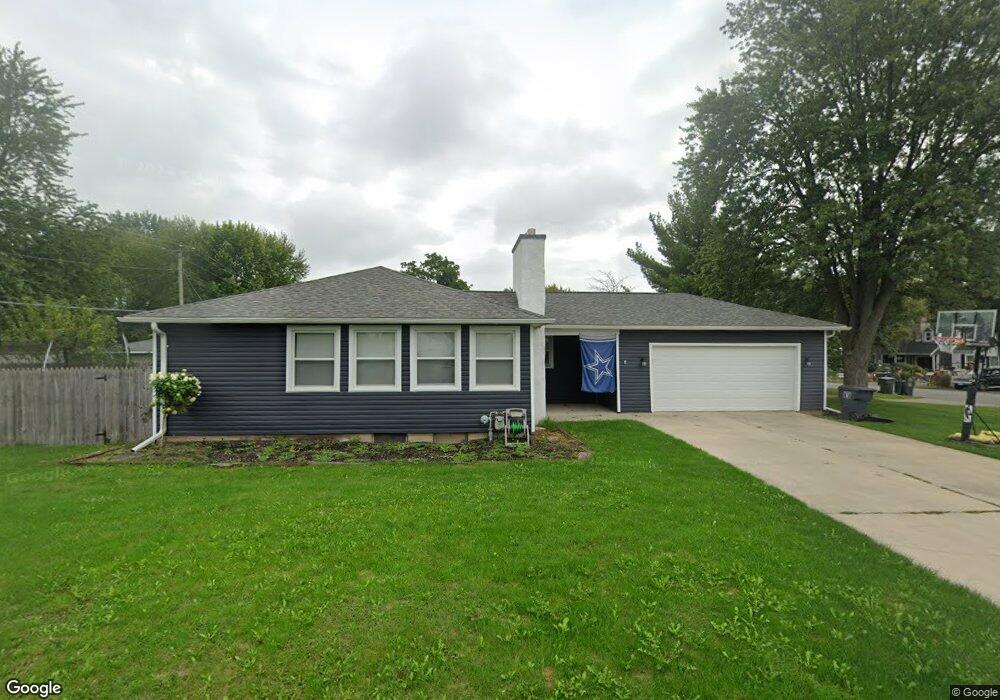
400 Cornell Dr Lima, OH 45805
Westgate NeighborhoodEstimated Value: $156,000
2
Beds
1
Bath
1,026
Sq Ft
$152/Sq Ft
Est. Value
About This Home
This home is located at 400 Cornell Dr, Lima, OH 45805 and is currently estimated at $156,000, approximately $152 per square foot. 400 Cornell Dr is a home located in Allen County with nearby schools including Heritage Elementary School, Lima West Middle School, and Lima North Middle School.
Ownership History
Date
Name
Owned For
Owner Type
Purchase Details
Closed on
Jan 31, 2008
Sold by
Bauman Andrew M and Bauman Marci
Bought by
Musto Scott R
Current Estimated Value
Home Financials for this Owner
Home Financials are based on the most recent Mortgage that was taken out on this home.
Original Mortgage
$71,900
Outstanding Balance
$45,731
Interest Rate
6.22%
Mortgage Type
Purchase Money Mortgage
Estimated Equity
$110,269
Purchase Details
Closed on
Jul 26, 2000
Sold by
Ricker Todd L
Bought by
Bauman Andrew M
Home Financials for this Owner
Home Financials are based on the most recent Mortgage that was taken out on this home.
Original Mortgage
$65,956
Interest Rate
8.27%
Mortgage Type
FHA
Purchase Details
Closed on
Nov 21, 1994
Sold by
Harrison Scott U
Bought by
Hendrisxon Dawn R and Ricker Todd L
Home Financials for this Owner
Home Financials are based on the most recent Mortgage that was taken out on this home.
Original Mortgage
$52,147
Interest Rate
8.91%
Mortgage Type
FHA
Purchase Details
Closed on
Nov 17, 1989
Bought by
Harrison Scott Ulrey
Create a Home Valuation Report for This Property
The Home Valuation Report is an in-depth analysis detailing your home's value as well as a comparison with similar homes in the area
Home Values in the Area
Average Home Value in this Area
Purchase History
| Date | Buyer | Sale Price | Title Company |
|---|---|---|---|
| Musto Scott R | $71,900 | Attorney | |
| Bauman Andrew M | $66,500 | -- | |
| Hendrisxon Dawn R | $55,000 | -- | |
| Harrison Scott Ulrey | $42,500 | -- |
Source: Public Records
Mortgage History
| Date | Status | Borrower | Loan Amount |
|---|---|---|---|
| Open | Musto Scott R | $71,900 | |
| Previous Owner | Bauman Andrew M | $65,956 | |
| Previous Owner | Hendrisxon Dawn R | $52,147 |
Source: Public Records
Tax History Compared to Growth
Tax History
| Year | Tax Paid | Tax Assessment Tax Assessment Total Assessment is a certain percentage of the fair market value that is determined by local assessors to be the total taxable value of land and additions on the property. | Land | Improvement |
|---|---|---|---|---|
| 2023 | $1,173 | $28,040 | $4,480 | $23,560 |
| 2022 | $1,179 | $28,040 | $4,480 | $23,560 |
| 2021 | $1,248 | $28,040 | $4,480 | $23,560 |
| 2020 | $1,151 | $22,830 | $4,310 | $18,520 |
| 2019 | $1,151 | $22,830 | $4,310 | $18,520 |
| 2018 | $1,083 | $22,830 | $4,310 | $18,520 |
| 2017 | $1,036 | $20,310 | $4,310 | $16,000 |
| 2016 | $1,045 | $20,310 | $4,310 | $16,000 |
| 2015 | $1,069 | $20,310 | $4,310 | $16,000 |
| 2014 | $1,069 | $20,590 | $4,240 | $16,350 |
| 2013 | $1,040 | $20,590 | $4,240 | $16,350 |
Source: Public Records
Map
Nearby Homes
- 2100 University Blvd
- 209 N Dale Dr
- 2050 W Market St
- 514 N Cable Rd
- 1912 Hillcrest Dr
- 109 N Pears Ave
- 234 S Westwood Dr
- 391 N Fernwood Dr
- 1630 W Market St
- 1753 Leland Ave
- 1719 Latham Ave
- 1459 W Market St
- 858 Mackenzie Dr
- 1517 Allentown Rd
- 621 Fairfield Dr
- 918 Cornell Dr
- 1880 Wendell Ave
- 2700 Lowell Ave
- 120 S Woodlawn Ave
- 608 S Primrose Place