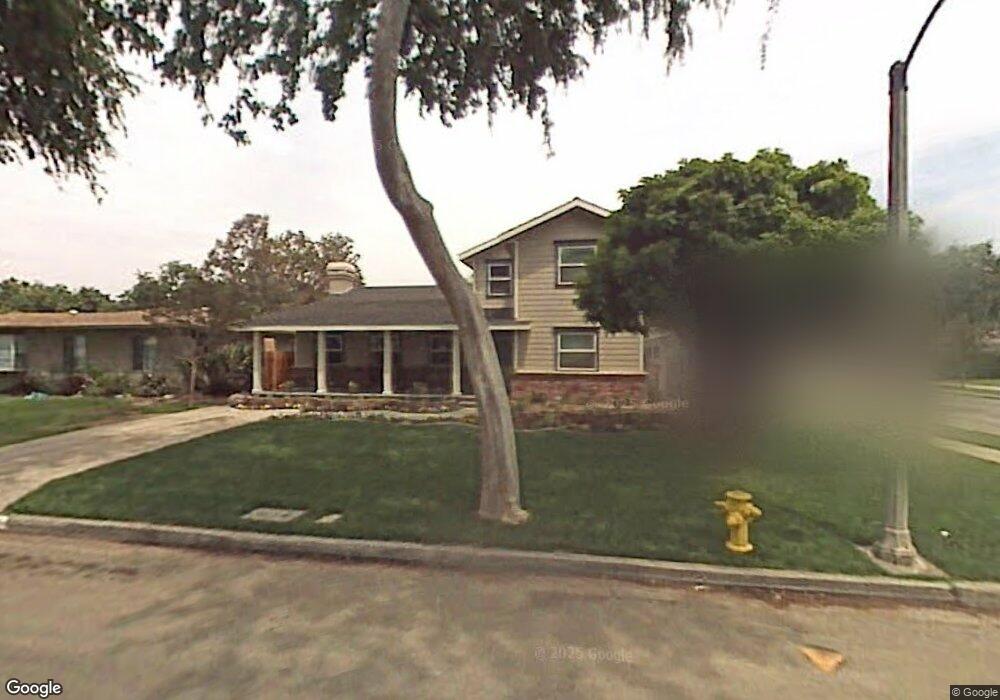
400 Delphine Place Fullerton, CA 92833
Estimated Value: $1,195,000 - $1,627,000
4
Beds
3
Baths
2,499
Sq Ft
$547/Sq Ft
Est. Value
About This Home
This home is located at 400 Delphine Place, Fullerton, CA 92833 and is currently estimated at $1,367,506, approximately $547 per square foot. 400 Delphine Place is a home located in Orange County with nearby schools including Fern Drive Elementary School, D. Russell Parks Junior High School, and Sunny Hills High School.
Ownership History
Date
Name
Owned For
Owner Type
Purchase Details
Closed on
Sep 26, 2005
Sold by
Gurley John Paul
Bought by
Gurley John Paul and Gurley Laurie Anne
Current Estimated Value
Home Financials for this Owner
Home Financials are based on the most recent Mortgage that was taken out on this home.
Original Mortgage
$290,000
Interest Rate
5.63%
Mortgage Type
Construction
Purchase Details
Closed on
Nov 16, 1998
Sold by
Paul Gurley John and Paul Michele Mary
Bought by
Gurley John Paul
Home Financials for this Owner
Home Financials are based on the most recent Mortgage that was taken out on this home.
Original Mortgage
$99,000
Interest Rate
6.98%
Purchase Details
Closed on
Jan 3, 1995
Sold by
Gurley John Paul and Gurley Mary Michele
Bought by
Gurley John Paul and Gurley Mary Michele
Home Financials for this Owner
Home Financials are based on the most recent Mortgage that was taken out on this home.
Original Mortgage
$29,000
Interest Rate
9.27%
Create a Home Valuation Report for This Property
The Home Valuation Report is an in-depth analysis detailing your home's value as well as a comparison with similar homes in the area
Home Values in the Area
Average Home Value in this Area
Purchase History
| Date | Buyer | Sale Price | Title Company |
|---|---|---|---|
| Gurley John Paul | -- | Equity Title Company | |
| Gurley John Paul | -- | Northern Counties Title Ins | |
| Gurley John Paul | -- | First American Title Insuran |
Source: Public Records
Mortgage History
| Date | Status | Borrower | Loan Amount |
|---|---|---|---|
| Closed | Gurley John Paul | $290,000 | |
| Closed | Gurley John Paul | $99,000 | |
| Closed | Gurley John Paul | $29,000 |
Source: Public Records
Tax History Compared to Growth
Tax History
| Year | Tax Paid | Tax Assessment Tax Assessment Total Assessment is a certain percentage of the fair market value that is determined by local assessors to be the total taxable value of land and additions on the property. | Land | Improvement |
|---|---|---|---|---|
| 2025 | $5,172 | $464,236 | $121,953 | $342,283 |
| 2024 | $5,172 | $455,134 | $119,562 | $335,572 |
| 2023 | $5,045 | $446,210 | $117,217 | $328,993 |
| 2022 | $5,009 | $437,461 | $114,918 | $322,543 |
| 2021 | $4,921 | $428,884 | $112,665 | $316,219 |
| 2020 | $4,893 | $424,487 | $111,510 | $312,977 |
| 2019 | $4,767 | $416,164 | $109,323 | $306,841 |
| 2018 | $4,694 | $408,004 | $107,179 | $300,825 |
| 2017 | $4,615 | $400,004 | $105,077 | $294,927 |
| 2016 | $4,519 | $392,161 | $103,016 | $289,145 |
| 2015 | $4,393 | $386,271 | $101,469 | $284,802 |
| 2014 | $4,265 | $378,705 | $99,481 | $279,224 |
Source: Public Records
Map
Nearby Homes
- 1814 W Jacaranda Place
- 830 Delphine Place
- 1123 Klose Ln
- 774 Stephens Ave
- 1301 W Fern Dr
- 1478 W Valencia Dr
- 1636 W Valencia Dr
- 1143 Norby Ln
- 308 N Sweet Ave
- 1107 Norby Ln
- 1448 W West Ave
- 1201 W Valencia Dr Unit SPC 201
- 1201 W Valencia Dr Unit 138
- 1201 W Valencia Dr Unit 146
- 1201 W Valencia Dr Unit 225
- 2006 Hetebrink St
- 1180 Cornwell Dr
- 433 435 N Basque
- 600 S Brookhurst Rd
- 619 S Brookhurst Rd
- 404 Delphine Place
- 408 Delphine Place Unit A
- 408 Delphine Place
- 401 Diana Place
- 405 Diana Place
- 1700 W Chapman Ave
- 1704 W Chapman Ave
- 405 Delphine Place
- 401 Delphine Place
- 1708 W Chapman Ave
- 329 Diana Place
- 409 Diana Place
- 409 Delphine Place
- 1712 W Chapman Ave
- 413 Delphine Place
- 413 Diana Place
- 325 Diana Place
- 416 Delphine Place
- 1716 W Chapman Ave
- 417 Delphine Place