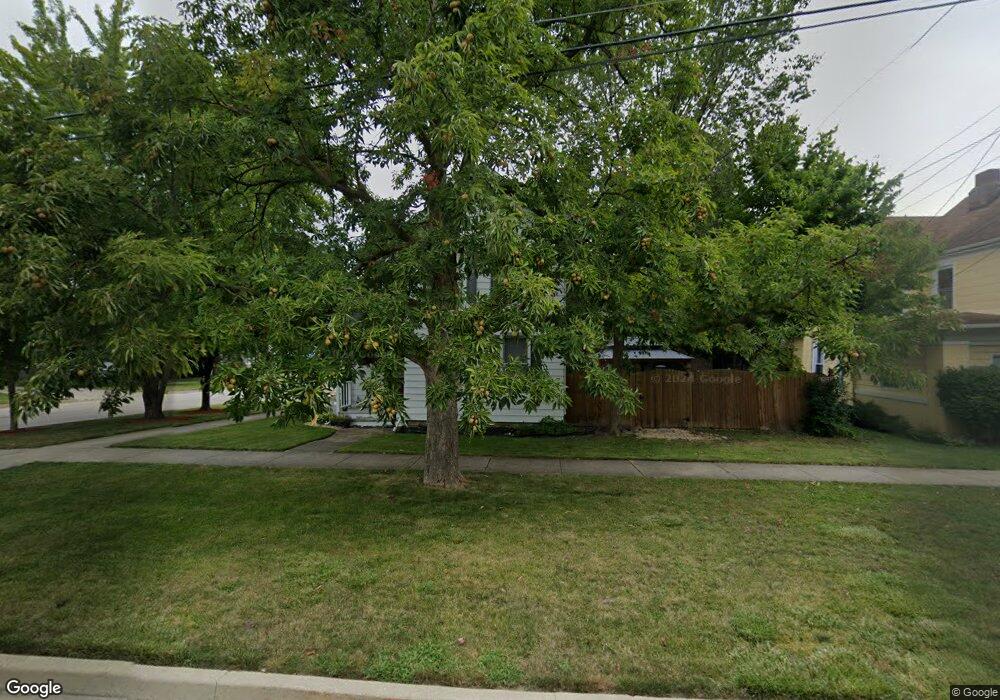
400 E 10th St Lockport, IL 60441
Estimated Value: $243,000 - $348,000
Studio
--
Bath
--
Sq Ft
5,663
Sq Ft Lot
About This Home
This home is located at 400 E 10th St, Lockport, IL 60441 and is currently estimated at $307,326. 400 E 10th St is a home located in Will County with nearby schools including Milne Grove Elementary School, Kelvin Grove Jr High School, and Lockport Township High School East.
Ownership History
Date
Name
Owned For
Owner Type
Purchase Details
Closed on
Sep 22, 2009
Sold by
Kennedy Brian D
Bought by
Kennedy Brian D and Kennedy June M
Current Estimated Value
Home Financials for this Owner
Home Financials are based on the most recent Mortgage that was taken out on this home.
Original Mortgage
$161,782
Outstanding Balance
$105,805
Interest Rate
5.19%
Mortgage Type
FHA
Estimated Equity
$201,521
Purchase Details
Closed on
Sep 18, 2003
Sold by
Bardell Michael J and Bardell Kathleen F
Bought by
Kennedy Brian D
Home Financials for this Owner
Home Financials are based on the most recent Mortgage that was taken out on this home.
Original Mortgage
$179,957
Interest Rate
6.44%
Mortgage Type
FHA
Purchase Details
Closed on
Nov 6, 1998
Sold by
Ward Gary M and Wilson Nancy S
Bought by
Bardell Michael J and Bardell Kathleen
Home Financials for this Owner
Home Financials are based on the most recent Mortgage that was taken out on this home.
Original Mortgage
$130,340
Interest Rate
6.8%
Create a Home Valuation Report for This Property
The Home Valuation Report is an in-depth analysis detailing your home's value as well as a comparison with similar homes in the area
Home Values in the Area
Average Home Value in this Area
Purchase History
| Date | Buyer | Sale Price | Title Company |
|---|---|---|---|
| Kennedy Brian D | -- | Multiple | |
| Kennedy Brian D | $180,000 | First American Title | |
| Bardell Michael J | $137,500 | -- |
Source: Public Records
Mortgage History
| Date | Status | Borrower | Loan Amount |
|---|---|---|---|
| Open | Kennedy Brian D | $161,782 | |
| Closed | Kennedy Brian D | $179,957 | |
| Previous Owner | Bardell Michael J | $130,340 |
Source: Public Records
Tax History
| Year | Tax Paid | Tax Assessment Tax Assessment Total Assessment is a certain percentage of the fair market value that is determined by local assessors to be the total taxable value of land and additions on the property. | Land | Improvement |
|---|---|---|---|---|
| 2024 | $6,337 | $81,815 | $18,364 | $63,451 |
| 2023 | $6,337 | $73,449 | $16,486 | $56,963 |
| 2022 | $5,755 | $68,513 | $15,378 | $53,135 |
| 2021 | $5,442 | $64,386 | $14,452 | $49,934 |
| 2020 | $5,297 | $62,269 | $13,977 | $48,292 |
| 2019 | $5,021 | $59,022 | $13,248 | $45,774 |
| 2018 | $4,711 | $54,564 | $12,248 | $42,316 |
| 2017 | $4,326 | $49,528 | $11,117 | $38,411 |
| 2016 | $4,046 | $45,688 | $10,255 | $35,433 |
| 2015 | $4,461 | $48,430 | $9,119 | $39,311 |
| 2014 | $4,461 | $46,567 | $8,768 | $37,799 |
| 2013 | $4,461 | $47,517 | $8,947 | $38,570 |
Source: Public Records
Map
Nearby Homes
- 1120 S Hamilton St
- 1016 S State St
- 1100 S State St
- 1200 S State St
- 519 S Washington St
- 202 E 14th St
- 1015 Grandview Ave
- 501 S Hamilton St
- 1509 East St Unit ST1511
- 1505 East St
- 1513 Connor Ave
- 502 W 7th St
- 500 Clinton St
- 516 Whelan St
- 107 S State St
- 136 W 18th St
- 120 N State St
- 417 Thornton St
- 118 N State St
- 2005 Princess Ct
- 408 E 10th St
- 920 S Jefferson St
- 330 E 10th St
- 918 S Jefferson St
- 919 S Jefferson St
- 420 E 10th St
- 915 S Jefferson St
- 421 E 9th St
- 1003 S Jefferson St
- 902 S Jefferson St
- 320 E 10th St
- 413 E 9th St
- 431 E 10th St
- 1007 S Jefferson St
- 1007 S Jefferson St Unit 2
- 1007 S Jefferson St Unit 1
- 331 E 9th St
- 419 E 9th St
- 929 Madison St
- 529 E 9th St Unit 2W
Your Personal Tour Guide
Ask me questions while you tour the home.