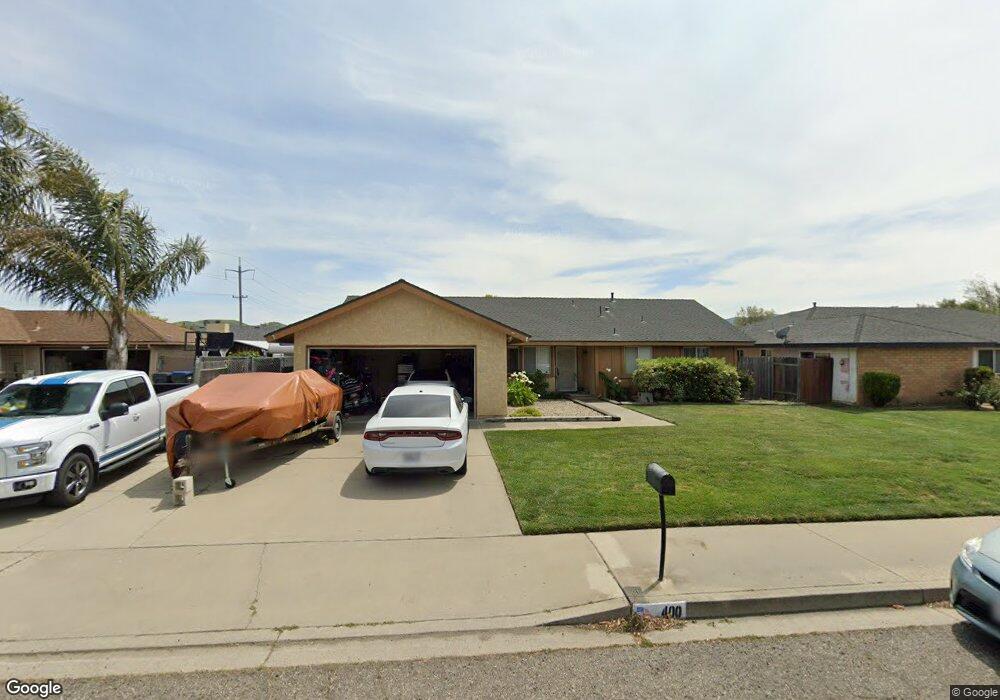
400 E Birch Ave Lompoc, CA 93436
Estimated Value: $574,156 - $680,000
3
Beds
2
Baths
1,583
Sq Ft
$390/Sq Ft
Est. Value
About This Home
This home is located at 400 E Birch Ave, Lompoc, CA 93436 and is currently estimated at $618,039, approximately $390 per square foot. 400 E Birch Ave is a home located in Santa Barbara County with nearby schools including La Honda STEAM Academy, Cabrillo High School, and Olive Grove Charter - Lompoc.
Ownership History
Date
Name
Owned For
Owner Type
Purchase Details
Closed on
Oct 26, 2021
Sold by
Garnica Edward and Garnica Rule
Bought by
Garnica Rule
Current Estimated Value
Home Financials for this Owner
Home Financials are based on the most recent Mortgage that was taken out on this home.
Original Mortgage
$122,750
Outstanding Balance
$112,179
Interest Rate
2.8%
Mortgage Type
New Conventional
Estimated Equity
$505,860
Purchase Details
Closed on
Sep 15, 2000
Sold by
Kevin Frary
Bought by
Garnica Edward and Garnica Ruie A
Home Financials for this Owner
Home Financials are based on the most recent Mortgage that was taken out on this home.
Original Mortgage
$161,100
Interest Rate
7.98%
Purchase Details
Closed on
Nov 3, 1994
Sold by
Federal Home Loan Mortgage Corporation
Bought by
Federal Home Loan Mortgage Corporation
Create a Home Valuation Report for This Property
The Home Valuation Report is an in-depth analysis detailing your home's value as well as a comparison with similar homes in the area
Home Values in the Area
Average Home Value in this Area
Purchase History
| Date | Buyer | Sale Price | Title Company |
|---|---|---|---|
| Garnica Rule | -- | First American Title Company | |
| Garnica Edward | $179,000 | Chicago Title Co | |
| Federal Home Loan Mortgage Corporation | $139,000 | Fidelity National Title Ins |
Source: Public Records
Mortgage History
| Date | Status | Borrower | Loan Amount |
|---|---|---|---|
| Open | Garnica Rule | $122,750 | |
| Closed | Garnica Edward | $161,100 |
Source: Public Records
Tax History
| Year | Tax Paid | Tax Assessment Tax Assessment Total Assessment is a certain percentage of the fair market value that is determined by local assessors to be the total taxable value of land and additions on the property. | Land | Improvement |
|---|---|---|---|---|
| 2025 | $2,882 | $269,700 | $90,399 | $179,301 |
| 2023 | $2,882 | $259,230 | $86,890 | $172,340 |
| 2022 | $2,828 | $254,148 | $85,187 | $168,961 |
| 2021 | $2,857 | $249,166 | $83,517 | $165,649 |
| 2020 | $2,826 | $246,612 | $82,661 | $163,951 |
| 2019 | $2,778 | $241,778 | $81,041 | $160,737 |
| 2018 | $2,734 | $237,038 | $79,452 | $157,586 |
| 2017 | $2,682 | $232,392 | $77,895 | $154,497 |
| 2016 | $2,632 | $227,836 | $76,368 | $151,468 |
| 2015 | $2,612 | $224,414 | $75,221 | $149,193 |
| 2014 | -- | $220,019 | $73,748 | $146,271 |
Source: Public Records
Map
Nearby Homes
- 100 California 1
- 1407 N H St
- 321 W North Ave Unit 133
- 701 E Pine Ave Unit 182
- 701 E Pine Ave Unit 176
- 701 E Pine Ave Unit 171
- 701 E Pine Ave Unit 161
- 1100 N Third St
- 1121 Bell Ave
- 1127 Bell Ave
- 610 E Pine Ave Unit 10
- 610 E Pine Ave Unit 29
- 610 E Pine Ave Unit 62
- 933 Bellflower Ln
- 533 N G St
- 1344 Village Meadows Dr
- 510 N I St
- 1012 W Anthony Way
- 1212 Timothy Ct
- 526 N L St
Your Personal Tour Guide
Ask me questions while you tour the home.