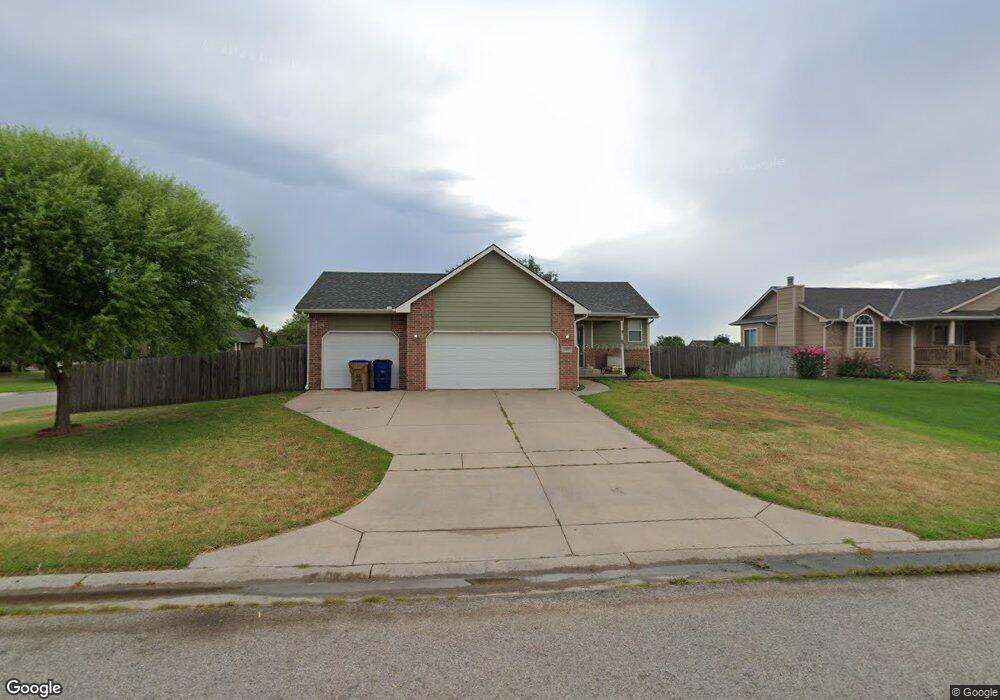
400 E Edwards St Bentley, KS 67016
Estimated Value: $234,000 - $255,498
2
Beds
3
Baths
1,097
Sq Ft
$223/Sq Ft
Est. Value
About This Home
This home is located at 400 E Edwards St, Bentley, KS 67016 and is currently estimated at $244,749, approximately $223 per square foot. 400 E Edwards St is a home located in Sedgwick County with nearby schools including Bentley Primary School, Halstead Middle School, and Halstead High School.
Ownership History
Date
Name
Owned For
Owner Type
Purchase Details
Closed on
May 5, 2025
Sold by
Mullins Brittany N and Bohrn Brittany N
Bought by
Bohrn Brittany N
Current Estimated Value
Home Financials for this Owner
Home Financials are based on the most recent Mortgage that was taken out on this home.
Original Mortgage
$85,000
Outstanding Balance
$83,804
Interest Rate
5.82%
Mortgage Type
New Conventional
Estimated Equity
$160,945
Purchase Details
Closed on
Jul 27, 2011
Sold by
Secretary Of Housing & Urban Development
Bought by
Mullins Brittany N
Home Financials for this Owner
Home Financials are based on the most recent Mortgage that was taken out on this home.
Original Mortgage
$97,201
Interest Rate
4.53%
Mortgage Type
New Conventional
Purchase Details
Closed on
Jul 20, 2010
Sold by
Mcgee Andrew J and Mcgee Angela L
Bought by
The Secretary Of Housing & Urban Develop
Create a Home Valuation Report for This Property
The Home Valuation Report is an in-depth analysis detailing your home's value as well as a comparison with similar homes in the area
Purchase History
| Date | Buyer | Sale Price | Title Company |
|---|---|---|---|
| Bohrn Brittany N | -- | None Listed On Document | |
| Mullins Brittany N | -- | Sec 1St | |
| The Secretary Of Housing & Urban Develop | $134,024 | Ctc |
Source: Public Records
Mortgage History
| Date | Status | Borrower | Loan Amount |
|---|---|---|---|
| Open | Bohrn Brittany N | $85,000 | |
| Previous Owner | Mullins Brittany N | $97,201 |
Source: Public Records
Tax History
| Year | Tax Paid | Tax Assessment Tax Assessment Total Assessment is a certain percentage of the fair market value that is determined by local assessors to be the total taxable value of land and additions on the property. | Land | Improvement |
|---|---|---|---|---|
| 2025 | $4,491 | $24,369 | $5,394 | $18,975 |
| 2023 | $4,491 | $20,551 | $2,473 | $18,078 |
| 2022 | $3,955 | $18,527 | $2,335 | $16,192 |
| 2021 | $3,758 | $17,320 | $2,335 | $14,985 |
| 2020 | $3,472 | $16,342 | $2,335 | $14,007 |
| 2019 | $3,346 | $15,135 | $2,335 | $12,800 |
| 2018 | $3,245 | $14,410 | $1,725 | $12,685 |
| 2017 | $3,227 | $0 | $0 | $0 |
| 2016 | $3,207 | $0 | $0 | $0 |
| 2015 | -- | $0 | $0 | $0 |
| 2014 | -- | $0 | $0 | $0 |
Source: Public Records
Map
Nearby Homes
- 401 E Edinborough Cir
- Lot 19 Block E
- Lot 18 Block E
- 00000 Castle Estates Replat Add Unit Lot 25 Block E
- 00000 Castle Estates Replat Add Unit Lot 27 Block E
- 00000 Castle Estates Replat Add Unit Lot 24 Block E
- 00000 Castle Estate Replat Add Unit Lot 26 Block E
- Lot 17 Block E
- Lot 24 Block E
- Lot 25 Block E
- Lot 16 Block E
- Lot 26 Block E
- 201 Rhodes Ct
- Lot 28 Block E
- Lot 29 Block E
- Lot 30 Block E
- 00 Castle Estates Replat Add
- 107 N Oxford Ave
- Lot 32 Block E
- Lot 33 Block E
- 402 E Edwards St
- 106 S Devinshire Ave
- 404 E Edwards St
- 0 S Devinshire Ave
- 117 N Devinshire Ave
- 10640 N Aurora St
- 3 S Berkshire Ave Unit BLOCK H LOT 3
- 1 S Berkshire Ave Unit BLOCK I LOT 1
- 103 S Devinshire Ave
- 105 S Berkshire Ave
- 0 Edinborough St Unit 265086
- 17 E Edinborough Unit BLOCK E LOT 17
- 14 E Edinborough Unit BLOCK E LOT 14
- 15 E Edinborough Unit BLOCK E LOT 15
- 16 E Edinborough Unit BLOCK E LOT 16
- 407 E Edinborough Cir
- 407 E Edinborough Cir Unit HUD 181220250
- 105 S Devinshire Ave
- 119 N Devinshire Ave
- 406 E Edwards St
Your Personal Tour Guide
Ask me questions while you tour the home.