
Seller's Agent in 2013
Steve McKowen
Jerry Grogg Inc
(260) 499-1900
1 in this area
5 Total Sales


Estimated Value: $213,000 - $230,000
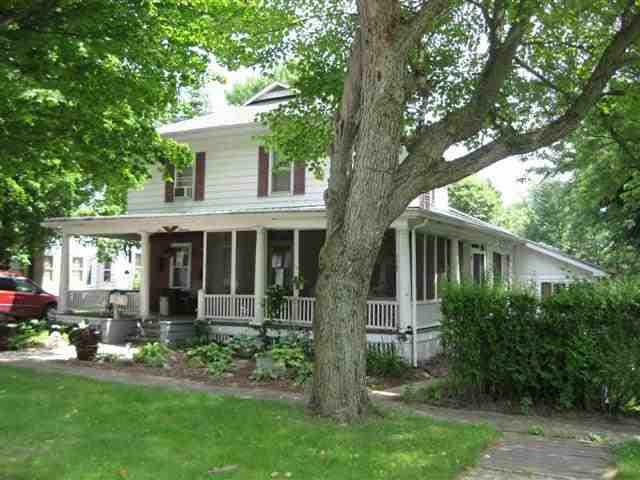
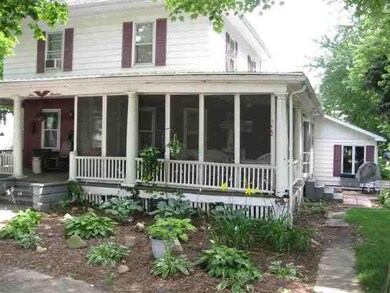
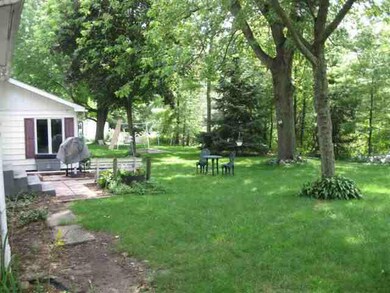
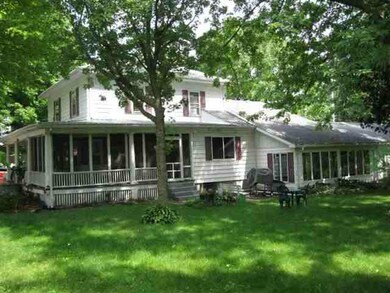
Great older home with plenty of potential. Natural finish woodwork, rosettes, victorian style trim, oak flooring. Large kitchen with breakfast area, dining room, great family room and master suite on main level. Three bedrooms on second level. Spacious city lot next to Fly Creek. Plenty of perrenials to add to the secluded landscaped yard. This home has plenty of space for your family. If you want to be in LaGrange don't miss seeing this fine home and make it your own.
Last Buyer's Agent
Stacy Rofkahr
Mike Thomas Associates
| Date | Buyer | Sale Price | Title Company |
|---|---|---|---|
| Joey Tennant | $72,000 | Lakeland Title Co |
| Date | Event | Price | List to Sale | Price per Sq Ft |
|---|---|---|---|---|
| 06/21/2013 06/21/13 | Sold | $72,000 | -21.7% | $29 / Sq Ft |
| 04/22/2013 04/22/13 | Pending | -- | -- | -- |
| 01/16/2013 01/16/13 | For Sale | $92,000 | -- | $37 / Sq Ft |
| Year | Tax Paid | Tax Assessment Tax Assessment Total Assessment is a certain percentage of the fair market value that is determined by local assessors to be the total taxable value of land and additions on the property. | Land | Improvement |
|---|---|---|---|---|
| 2025 | $1,429 | $204,900 | $20,900 | $184,000 |
| 2024 | $1,429 | $165,900 | $20,900 | $145,000 |
| 2023 | $1,268 | $161,400 | $20,300 | $141,100 |
| 2022 | $1,282 | $141,700 | $17,600 | $124,100 |
| 2021 | $1,094 | $124,600 | $16,800 | $107,800 |
| 2020 | $883 | $114,900 | $15,100 | $99,800 |
| 2019 | $810 | $110,400 | $15,100 | $95,300 |
| 2018 | $829 | $109,400 | $15,100 | $94,300 |
| 2017 | $843 | $110,200 | $15,100 | $95,100 |
| 2016 | $349 | $72,600 | $15,100 | $57,500 |
| 2014 | $373 | $77,200 | $15,100 | $62,100 |
| 2013 | $373 | $119,100 | $15,100 | $104,000 |
Seller's Agent in 2013
Steve McKowen
Jerry Grogg Inc
(260) 499-1900
1 in this area
5 Total Sales
S
Buyer's Agent in 2013
Stacy Rofkahr
Mike Thomas Associates
Source: Indiana Regional MLS
MLS Number: 521542
APN: 44-07-19-400-002.092-002
Disclaimer: Certain information contained herein is derived from information provided by parties other than Homes.com. All information provided is deemed reliable, but is not guaranteed to be accurate and should be independently verified.
![]() Based on information submitted to the MLS GRID. All data is obtained from various sources and may not have been verified by broker or MLS GRID. Supplied Open House Information is subject to change without notice. All information should be independently reviewed and verified for accuracy. Properties may or may not be listed by the office/agent presenting the information. Some IDX listings have been excluded from this website. IDX information is provided exclusively for personal, non-commercial use, and may not be used for any purpose other than to identify prospective properties consumers may be interested in purchasing. Information is deemed reliable but not guaranteed.
Based on information submitted to the MLS GRID. All data is obtained from various sources and may not have been verified by broker or MLS GRID. Supplied Open House Information is subject to change without notice. All information should be independently reviewed and verified for accuracy. Properties may or may not be listed by the office/agent presenting the information. Some IDX listings have been excluded from this website. IDX information is provided exclusively for personal, non-commercial use, and may not be used for any purpose other than to identify prospective properties consumers may be interested in purchasing. Information is deemed reliable but not guaranteed.
Based on information submitted to the MLS GRID
Ask me questions while you tour the home.