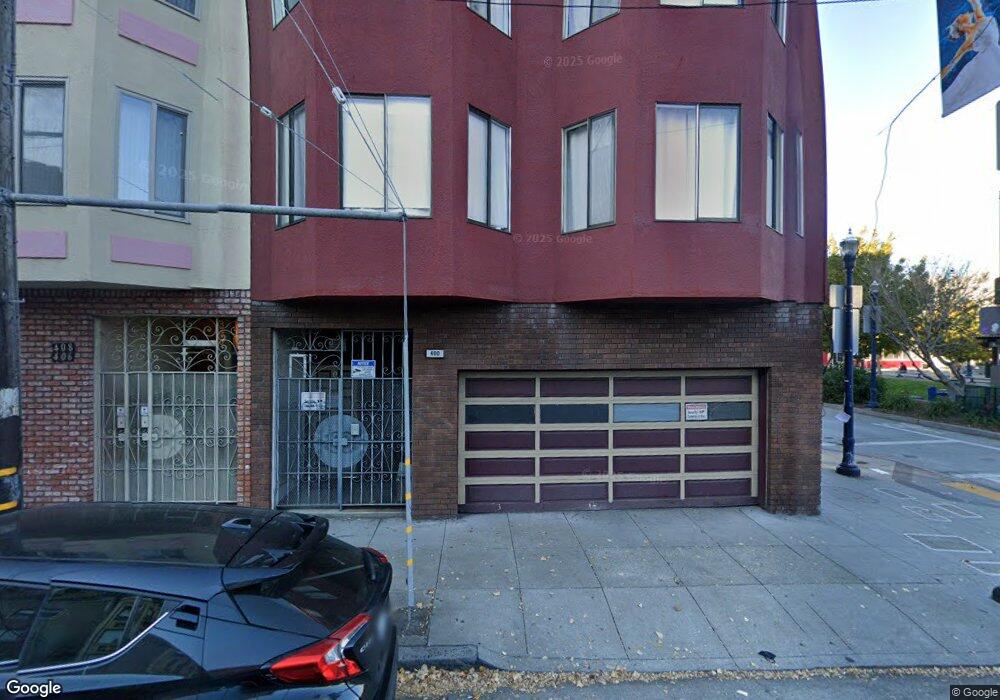
400 Fell St Unit 1 San Francisco, CA 94102
Hayes Valley NeighborhoodEstimated Value: $1,347,000 - $2,301,530
1
Bed
1
Bath
3,180
Sq Ft
$566/Sq Ft
Est. Value
About This Home
This home is located at 400 Fell St Unit 1, San Francisco, CA 94102 and is currently estimated at $1,801,383, approximately $566 per square foot. 400 Fell St Unit 1 is a home located in San Francisco County with nearby schools including Muir (John) Elementary School, James Lick Middle School, and French American International School + International High School.
Ownership History
Date
Name
Owned For
Owner Type
Purchase Details
Closed on
May 30, 2020
Sold by
Wymiarkiewicz Malgorzata
Bought by
Slawomir Wymiaridemicz
Current Estimated Value
Purchase Details
Closed on
Apr 26, 2019
Sold by
Cust Wymiarkiewicz Slawomir
Bought by
Cust Wymiarkiewicz Slawomir
Purchase Details
Closed on
May 13, 2002
Sold by
Wymiarkiewicz Slawomir and Wymiarkiewicz Renate
Bought by
Wymiarkiewicz Sonia and Wymiarkiewicz Slawomir
Purchase Details
Closed on
Mar 23, 1998
Sold by
Kenery 1994 Family Trust The
Bought by
Wymiarkiewicz Slawomir and Wymiarkiewicz Renate
Home Financials for this Owner
Home Financials are based on the most recent Mortgage that was taken out on this home.
Original Mortgage
$382,500
Interest Rate
9.75%
Mortgage Type
Commercial
Purchase Details
Closed on
Jul 8, 1994
Sold by
Kenery Nicolas A and Kenery Victoria N
Bought by
Kenery Nicolas A and Kenery Victoria N
Create a Home Valuation Report for This Property
The Home Valuation Report is an in-depth analysis detailing your home's value as well as a comparison with similar homes in the area
Home Values in the Area
Average Home Value in this Area
Purchase History
| Date | Buyer | Sale Price | Title Company |
|---|---|---|---|
| Slawomir Wymiaridemicz | -- | None Listed On Document | |
| Cust Wymiarkiewicz Slawomir | -- | None Available | |
| Wymiarkiewicz Sonia | -- | -- | |
| Wymiarkiewicz Slawomir | $425,000 | Fidelity National Title Co | |
| Kenery Nicolas A | -- | -- |
Source: Public Records
Mortgage History
| Date | Status | Borrower | Loan Amount |
|---|---|---|---|
| Previous Owner | Wymiarkiewicz Slawomir | $382,500 |
Source: Public Records
Tax History Compared to Growth
Tax History
| Year | Tax Paid | Tax Assessment Tax Assessment Total Assessment is a certain percentage of the fair market value that is determined by local assessors to be the total taxable value of land and additions on the property. | Land | Improvement |
|---|---|---|---|---|
| 2025 | $9,647 | $724,694 | $478,970 | $245,724 |
| 2024 | $9,647 | $710,490 | $469,580 | $240,910 |
| 2023 | $9,365 | $696,564 | $460,374 | $236,190 |
| 2022 | $9,136 | $682,951 | $451,363 | $231,588 |
| 2021 | $8,977 | $669,562 | $442,513 | $227,049 |
| 2020 | $9,078 | $662,701 | $437,977 | $224,724 |
| 2019 | $8,700 | $649,711 | $429,391 | $220,320 |
| 2018 | $8,414 | $636,909 | $420,933 | $215,976 |
| 2017 | $8,019 | $624,423 | $412,680 | $211,743 |
| 2016 | $7,872 | $612,183 | $404,589 | $207,594 |
| 2015 | $7,774 | $602,994 | $398,514 | $204,480 |
| 2014 | $7,578 | $591,183 | $390,708 | $200,475 |
Source: Public Records
Map
Nearby Homes
- 469 Ivy St
- 450 Hayes St Unit 3H
- 430 Hayes St Unit 201
- 634 Laguna St Unit C
- 615-617 Octavia St
- 415 Laguna St
- 555 Fulton St Unit 518
- 555 Fulton St Unit 427
- 555 Fulton St Unit 322
- 610 Buchanan St Unit 1
- 342 Hayes St Unit M
- 388 Fulton St Unit 208
- 388 Fulton St Unit 603
- 388 Fulton St Unit 404
- 55 Page St Unit 514
- 55 Page St Unit 219
- 675-677 Ivy St
- 675 Ivy St Unit 677
- 47 Octavia St
- 700 Fell St Unit 5
- 400 Fell St
- 406 Fell St Unit 408
- 412 Fell St
- 420 Fell St Unit 422
- 417 Linden St Unit 1
- 417 Linden St
- 419 Linden St
- 426 Fell St
- 430 Fell St
- 425 Linden St
- 436 Fell St
- 355 Octavia St
- 414 Linden St
- 412 Linden St Unit 414
- 416 Linden St
- 420 Linden St
- 442 Fell St
- 441 Linden St Unit 443
- 441 Linden St
- 425 Fell St