400 Fountain Lake Dr Memphis, TN 38120
East Memphis NeighborhoodEstimated Value: $288,000 - $354,000
3
Beds
3
Baths
1,995
Sq Ft
$162/Sq Ft
Est. Value
About This Home
This home is located at 400 Fountain Lake Dr, Memphis, TN 38120 and is currently estimated at $322,194, approximately $161 per square foot. 400 Fountain Lake Dr is a home located in Shelby County with nearby schools including Richland Elementary School, White Station Middle, and White Station High.
Ownership History
Date
Name
Owned For
Owner Type
Purchase Details
Closed on
Oct 18, 2021
Sold by
Bynum Anita M and Bynum Ophelia Jones
Bought by
Graves Carmen
Current Estimated Value
Home Financials for this Owner
Home Financials are based on the most recent Mortgage that was taken out on this home.
Original Mortgage
$210,000
Outstanding Balance
$186,558
Interest Rate
1.47%
Mortgage Type
New Conventional
Estimated Equity
$135,636
Purchase Details
Closed on
Feb 7, 2019
Sold by
Bynum Anita M
Bought by
Bynum Anita M and Cumberland Trust And Investment Co
Purchase Details
Closed on
Feb 2, 2007
Sold by
Bynum Ophelia Jones
Bought by
Ophelia Jones Bynum Trust
Purchase Details
Closed on
Nov 30, 2006
Sold by
Walter H Bynum Revocable Trust
Bought by
Walter Hatfield Bynum Marital Trust
Purchase Details
Closed on
Apr 12, 2005
Sold by
Bynum Ophelia J
Bought by
Bynum Ophelia Jones and Bynum Walter Hatfield
Purchase Details
Closed on
Feb 26, 1999
Sold by
Lenox Homes Llc
Bought by
Bynum Walter H and Bynum Ophelia J
Create a Home Valuation Report for This Property
The Home Valuation Report is an in-depth analysis detailing your home's value as well as a comparison with similar homes in the area
Home Values in the Area
Average Home Value in this Area
Purchase History
| Date | Buyer | Sale Price | Title Company |
|---|---|---|---|
| Graves Carmen | $310,000 | Home Surety T&E Llc | |
| Bynum Anita M | -- | None Available | |
| Ophelia Jones Bynum Trust | -- | None Available | |
| Bynum Ophelia Jones | -- | None Available | |
| Walter Hatfield Bynum Marital Trust | -- | None Available | |
| Bynum Ophelia Jones | -- | -- | |
| Walnut Hatfield Bynum Trust | -- | -- | |
| Bynum Walter H | -- | -- | |
| Bynum Walter H | $192,213 | -- | |
| Bynum Walter H | $192,213 | -- |
Source: Public Records
Mortgage History
| Date | Status | Borrower | Loan Amount |
|---|---|---|---|
| Open | Graves Carmen | $210,000 |
Source: Public Records
Tax History Compared to Growth
Tax History
| Year | Tax Paid | Tax Assessment Tax Assessment Total Assessment is a certain percentage of the fair market value that is determined by local assessors to be the total taxable value of land and additions on the property. | Land | Improvement |
|---|---|---|---|---|
| 2025 | $2,299 | $81,950 | $16,500 | $65,450 |
| 2024 | $2,299 | $67,825 | $24,250 | $43,575 |
| 2023 | $4,132 | $67,825 | $24,250 | $43,575 |
| 2022 | $4,132 | $67,825 | $24,250 | $43,575 |
| 2021 | $4,911 | $67,825 | $24,250 | $43,575 |
| 2020 | $1,786 | $55,875 | $24,250 | $31,625 |
| 2019 | $1,786 | $55,875 | $24,250 | $31,625 |
| 2018 | $1,894 | $59,250 | $24,250 | $35,000 |
| 2017 | $1,938 | $59,250 | $24,250 | $35,000 |
| 2016 | $2,180 | $49,875 | $0 | $0 |
| 2014 | $2,180 | $49,875 | $0 | $0 |
Source: Public Records
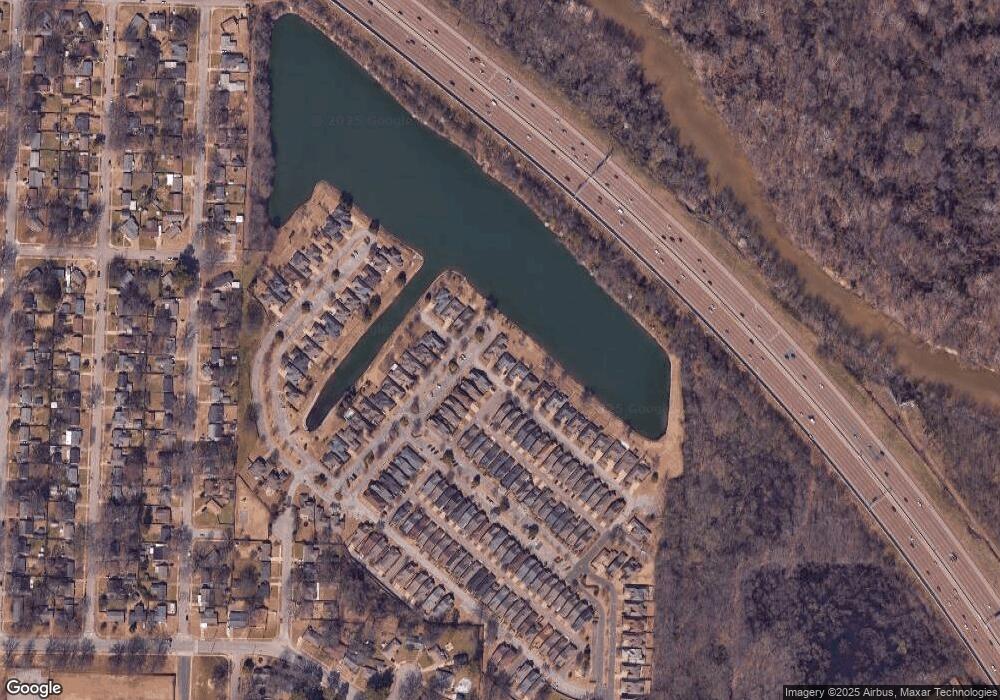
Map
Nearby Homes
- 377 Fountain Lake Dr
- 409 Malboro Rd
- 421 Mcdermitt Rd
- 536 Wheaton Park Cove N
- 430 Mcelroy Rd
- 248 N Yates Rd
- 5344 Panda Ln
- 379 Mcelroy Rd
- 5704 Ashbriar Ave
- 407 Meadvale Rd
- 416 Rosser Rd
- 400 Rosser Rd
- 5737 Buxbriar Ave
- 446 Rosser Rd
- 5313 Chickasaw Rd
- 559 Chalmers Rd
- 529 Fleda Rd
- 296 N White Station Rd
- 448 N White Station Rd
- 5238 Peg Ln
- 390 Fountain Lake Dr
- 380 Fountain Lake Dr
- 5583 Fountain Bay Dr
- 414 Fountain Lake Dr
- 374 Fountain Lake Dr
- 5579 Fountain Bay Dr
- 424 Fountain Lake Dr
- 5575 Fountain Bay Dr
- 368 Fountain Lake Dr
- 5580 Fountain Bay Dr
- 434 Fountain Lake Dr
- 5571 Fountain Bay Dr
- 371 Fountain Lake Dr
- 5576 Fountain Bay Dr
- 362 Fountain Lake Dr
- 367 Fountain Lake Dr
- 5567 Fountain Bay Dr
- 5572 Fountain Bay Dr
- 380 Fountain River Dr
- 356 Fountain Lake Dr