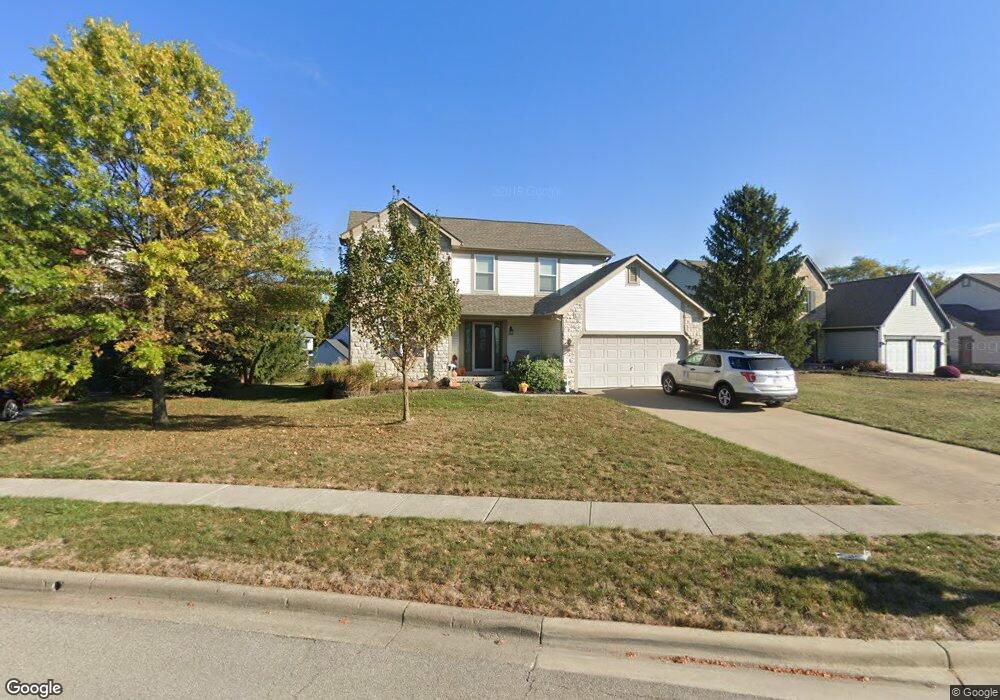
400 Glenside Ln Powell, OH 43065
Estimated Value: $424,000 - $466,000
4
Beds
3
Baths
2,590
Sq Ft
$173/Sq Ft
Est. Value
About This Home
This home is located at 400 Glenside Ln, Powell, OH 43065 and is currently estimated at $449,186, approximately $173 per square foot. 400 Glenside Ln is a home located in Delaware County with nearby schools including Heritage Elementary School, Olentangy Shanahan Middle School, and Olentangy High School.
Ownership History
Date
Name
Owned For
Owner Type
Purchase Details
Closed on
Jul 29, 2021
Sold by
Snyder Harold R and Snyder Monica R
Bought by
Gyasi Emmanuel and Obeng Gloria Serwaa
Current Estimated Value
Home Financials for this Owner
Home Financials are based on the most recent Mortgage that was taken out on this home.
Original Mortgage
$295,900
Outstanding Balance
$266,295
Interest Rate
2.8%
Mortgage Type
New Conventional
Estimated Equity
$182,891
Purchase Details
Closed on
Sep 18, 2000
Sold by
Mori Shigeham
Bought by
Snyder Harold R and Snyder Monica R
Home Financials for this Owner
Home Financials are based on the most recent Mortgage that was taken out on this home.
Original Mortgage
$100,000
Interest Rate
8.14%
Mortgage Type
Balloon
Purchase Details
Closed on
Apr 11, 1996
Sold by
Autumnwood Homes Inc
Bought by
Mori Shigeham
Create a Home Valuation Report for This Property
The Home Valuation Report is an in-depth analysis detailing your home's value as well as a comparison with similar homes in the area
Home Values in the Area
Average Home Value in this Area
Purchase History
| Date | Buyer | Sale Price | Title Company |
|---|---|---|---|
| Gyasi Emmanuel | $369,900 | First Ohio Title Insurance | |
| Snyder Harold R | $186,000 | -- | |
| Mori Shigeham | $172,000 | -- |
Source: Public Records
Mortgage History
| Date | Status | Borrower | Loan Amount |
|---|---|---|---|
| Open | Gyasi Emmanuel | $295,900 | |
| Closed | Snyder Harold R | $100,000 |
Source: Public Records
Tax History
| Year | Tax Paid | Tax Assessment Tax Assessment Total Assessment is a certain percentage of the fair market value that is determined by local assessors to be the total taxable value of land and additions on the property. | Land | Improvement |
|---|---|---|---|---|
| 2024 | $7,123 | $129,150 | $31,640 | $97,510 |
| 2023 | $7,149 | $129,150 | $31,640 | $97,510 |
| 2022 | $6,239 | $91,670 | $19,290 | $72,380 |
| 2021 | $6,274 | $91,670 | $19,290 | $72,380 |
| 2020 | $6,304 | $91,670 | $19,290 | $72,380 |
| 2019 | $5,182 | $78,130 | $19,290 | $58,840 |
| 2018 | $5,206 | $78,130 | $19,290 | $58,840 |
| 2017 | $5,152 | $74,420 | $15,440 | $58,980 |
| 2016 | $5,282 | $74,420 | $15,440 | $58,980 |
| 2015 | $4,819 | $74,420 | $15,440 | $58,980 |
| 2014 | $4,888 | $74,420 | $15,440 | $58,980 |
| 2013 | $4,848 | $72,140 | $15,440 | $56,700 |
Source: Public Records
Map
Nearby Homes
- 88 Ravine Rd
- 202 Deer Cross Ln Unit 202
- 8268 Coppertop Ln
- 423 Hidden Ravines Dr
- 350 Summer Tree Way
- 8552 Misty Woods Cir
- 270 W Orange Rd
- 669 Spring Valley Dr
- 810 Mystic Pointe Dr
- 789 Hidden Springs Dr
- 0 N Parkway Dr Unit 225026764
- 8056 Orange Station Loop
- 1248 Westwood Dr
- 8870 Olentangy River Rd
- 0 Orangepoint Dr
- 5700 Columbus Pike
- 8060 Gladshire Blvd
- 7601 Overland Trail
- 9152 Longstone Dr
- 7424 Gooding Blvd
- 404 Glenside Ln
- 394 Glenside Ln
- 370 Glenside Ln
- 366 Glenside Ln
- 408 Glenside Ln
- 405 Glenside Ln
- 391 Glenside Ln
- 362 Glenside Ln
- 377 Glenside Ln
- 412 Glenside Ln
- 217 Meadow View Dr
- 225 Hideaway Ct
- 416 Glenside Ln
- 425 Glenside Ln
- 223 Meadow View Dr
- 226 Meadow View Dr
- 420 Glenside Ln
- 229 Hideaway Ct
- 365 Glenside Ln
- 256 Fox Ridge Cir
Your Personal Tour Guide
Ask me questions while you tour the home.