Estimated Value: $302,000 - $454,000
2
Beds
2
Baths
900
Sq Ft
$400/Sq Ft
Est. Value
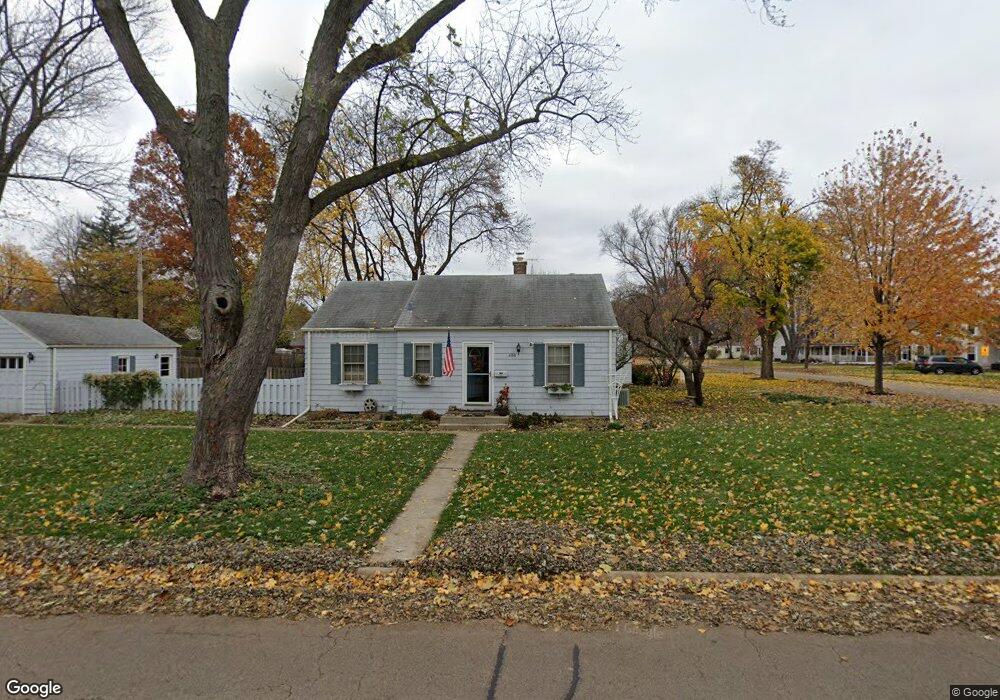
About This Home
This home is located at 400 Gray St, Saint Charles, IL 60174 and is currently estimated at $359,855, approximately $399 per square foot. 400 Gray St is a home located in Kane County with nearby schools including Davis Primary School, Richmond Intermediate School, and Thompson Middle School.
Ownership History
Date
Name
Owned For
Owner Type
Purchase Details
Closed on
Jun 20, 2016
Sold by
Shumaker Thomas and Shumaker Danielle
Bought by
Evans Suzanne K
Current Estimated Value
Home Financials for this Owner
Home Financials are based on the most recent Mortgage that was taken out on this home.
Original Mortgage
$148,800
Outstanding Balance
$118,698
Interest Rate
3.64%
Mortgage Type
New Conventional
Estimated Equity
$241,157
Purchase Details
Closed on
Jul 26, 1996
Sold by
Dillenburg Thomas E and Dillenburg Amy J
Bought by
Shumaker Thomas A and Shumaker Danielle D
Home Financials for this Owner
Home Financials are based on the most recent Mortgage that was taken out on this home.
Original Mortgage
$118,350
Interest Rate
8.33%
Create a Home Valuation Report for This Property
The Home Valuation Report is an in-depth analysis detailing your home's value as well as a comparison with similar homes in the area
Home Values in the Area
Average Home Value in this Area
Purchase History
| Date | Buyer | Sale Price | Title Company |
|---|---|---|---|
| Evans Suzanne K | $186,000 | None Available | |
| Shumaker Thomas A | $131,500 | Chicago Title Insurance Co |
Source: Public Records
Mortgage History
| Date | Status | Borrower | Loan Amount |
|---|---|---|---|
| Open | Evans Suzanne K | $148,800 | |
| Previous Owner | Shumaker Thomas A | $118,350 |
Source: Public Records
Tax History Compared to Growth
Tax History
| Year | Tax Paid | Tax Assessment Tax Assessment Total Assessment is a certain percentage of the fair market value that is determined by local assessors to be the total taxable value of land and additions on the property. | Land | Improvement |
|---|---|---|---|---|
| 2024 | $5,645 | $92,052 | $32,398 | $59,654 |
| 2023 | $4,589 | $82,388 | $28,997 | $53,391 |
| 2022 | $5,033 | $78,400 | $28,406 | $49,994 |
| 2021 | $5,084 | $74,731 | $27,077 | $47,654 |
| 2020 | $5,130 | $73,337 | $26,572 | $46,765 |
| 2019 | $5,025 | $71,885 | $26,046 | $45,839 |
| 2018 | $5,156 | $68,157 | $23,429 | $44,728 |
| 2017 | $5,013 | $65,827 | $22,628 | $43,199 |
| 2016 | $5,254 | $63,515 | $21,833 | $41,682 |
| 2015 | -- | $60,117 | $21,598 | $38,519 |
| 2014 | -- | $57,164 | $21,598 | $35,566 |
| 2013 | -- | $57,909 | $21,814 | $36,095 |
Source: Public Records
Map
Nearby Homes
- 629 N Lincoln Ave
- 82 Gray St
- 1326 Elm St
- 1028 S 5th St
- 806 Fellows St
- 1017 S 6th St
- 2749 Stone Cir
- 2753 Stone Cir
- 2747 Stone Cir
- 2751 Stone Cir
- 1008 Pine St
- 885 Geneva Rd
- Lot 1 Keller Place
- Lot 2 Geneva Rd
- Lot 1 Geneva Rd
- 602 Highbury Ln
- 1108 S 12th St Unit 2
- 1211 James St
- 1336-1338 S 14th St
- 1330-1332 S 14th St
- 1433 S 4th St
- 814 Mckinley Ave
- 1427 S 4th St Unit 1
- 1432 S 5th St
- 1426 S 5th St
- 815 N Lincoln Ave Unit 4
- 808 Mckinley Ave
- 1421 S 4th St
- 318 Gray St Unit 1
- 1432 S 4th St
- 815 Mckinley Ave
- 807 N Lincoln Ave
- 1420 S 5th St
- 1426 S 4th St
- 800 Mckinley Ave Unit 2
- 1415 S 4th St
- 807 Mckinley Ave
- 801 N Lincoln Ave Unit 4
- 1414 S 5th St
- 1420 S 4th St