400 Horseshoe Bend Rd Carrollton, GA 30116
Abilene NeighborhoodEstimated Value: $361,000 - $613,670
3
Beds
2
Baths
2,202
Sq Ft
$206/Sq Ft
Est. Value
About This Home
This home is located at 400 Horseshoe Bend Rd, Carrollton, GA 30116 and is currently estimated at $454,223, approximately $206 per square foot. 400 Horseshoe Bend Rd is a home located in Carroll County with nearby schools including Sharp Creek Elementary School, Bay Springs Middle School, and Villa Rica High School.
Ownership History
Date
Name
Owned For
Owner Type
Purchase Details
Closed on
Mar 10, 2023
Sold by
Alexander Cynthia Forbus
Bought by
Alexander Marvin Dale and Alexander Family Tr
Current Estimated Value
Purchase Details
Closed on
Jan 7, 2016
Sold by
Forbus Steve
Bought by
Alexander Bryan Heath
Purchase Details
Closed on
Aug 17, 2015
Sold by
Forbus Steve D
Bought by
Forbus D Steve and Alexander Cynthia Forbus
Purchase Details
Closed on
May 15, 2003
Sold by
Alexander Dale and Alexander Cindy
Bought by
Forbus Steve and Forbus Sara
Purchase Details
Closed on
Dec 30, 1992
Sold by
Forbus Steve
Bought by
Forbus Steve and Forbus Sara
Purchase Details
Closed on
Sep 3, 1983
Sold by
Morgan Thomas W & Joseph W Estates
Bought by
Forbus Steve
Create a Home Valuation Report for This Property
The Home Valuation Report is an in-depth analysis detailing your home's value as well as a comparison with similar homes in the area
Home Values in the Area
Average Home Value in this Area
Purchase History
| Date | Buyer | Sale Price | Title Company |
|---|---|---|---|
| Alexander Marvin Dale | -- | -- | |
| Alexander Bryan Heath | -- | -- | |
| Forbus D Steve | -- | -- | |
| Forbus Steve | -- | -- | |
| Forbus Steve | -- | -- | |
| Forbus Steve | -- | -- |
Source: Public Records
Tax History Compared to Growth
Tax History
| Year | Tax Paid | Tax Assessment Tax Assessment Total Assessment is a certain percentage of the fair market value that is determined by local assessors to be the total taxable value of land and additions on the property. | Land | Improvement |
|---|---|---|---|---|
| 2024 | -- | $240,886 | $109,624 | $131,262 |
| 2023 | $0 | $208,586 | $87,699 | $120,887 |
| 2022 | $164 | $155,520 | $58,466 | $97,054 |
| 2021 | $247 | $131,365 | $46,772 | $84,593 |
| 2020 | $276 | $116,293 | $42,519 | $73,774 |
| 2019 | $281 | $111,413 | $42,519 | $68,894 |
| 2018 | $276 | $107,340 | $45,107 | $62,233 |
| 2017 | $276 | $107,340 | $45,107 | $62,233 |
| 2016 | $273 | $107,340 | $45,107 | $62,233 |
| 2015 | $461 | $74,350 | $22,718 | $51,632 |
| 2014 | $462 | $74,351 | $22,718 | $51,632 |
Source: Public Records
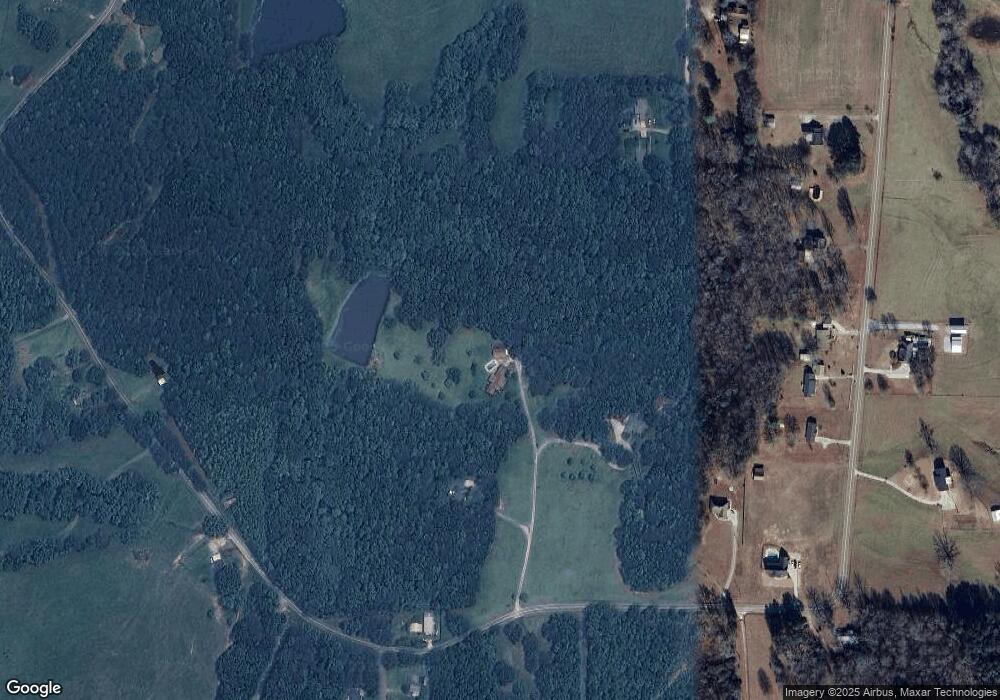
Map
Nearby Homes
- 10 Deerfield Ln
- 133 Deerfield Ln
- 201 Deerfield Ln
- 3279 Shady Grove Rd
- 183 Muse Bridge Rd
- 0 Frashier Rd Unit 7549781
- 0 Frashier Rd Unit 10488685
- 160 Old Sandhill Rd
- 202 Old Sandhill Rd
- 255 Emerald Pointe Dr
- 436 Laurel Trace
- 377 Dock Hyde Rd
- 22 Shell Rd
- 136 Jennifer Ln
- 315 Terrace Ridge
- 509 Tree Ridge Dr
- 56 Dahlia Ct
- 55 Sage Hill Dr
- 0 Roy Morgan Rd Unit 17.44 ACRES
- 160 & 168 Roy Morgan Rd
- 444 Horseshoe Bend Rd
- 390 Horseshoe Bend Rd
- 115 Martin Sheffield Rd
- 0 Horseshoe Bend Rd Unit 7350908
- 0 Horseshoe Bend Rd Unit 7414177
- 0 Horseshoe Bend Rd Unit 7328568
- 0 Horseshoe Bend Rd Unit 8550765
- 0 Horseshoe Bend Rd Unit 8441748
- 0 Horseshoe Bend Rd
- 125 Martin Sheffield Rd
- 450 Horseshoe Bend Rd
- 600 Horseshoe Bend Rd
- 584 Horseshoe Bend Rd
- 120 Martin Sheffield Rd
- 648 Horseshoe Bend Rd
- 616 Horseshoe Bend Rd
- 500 Horseshoe Bend Rd
- 309 Horseshoe Bend Rd
- 15 Deerfield Ln
- 20 Deerfield Ln