400 Jefferson St Victor, IA 52347
Estimated Value: $193,000 - $243,000
--
Bed
--
Bath
1,360
Sq Ft
$162/Sq Ft
Est. Value
About This Home
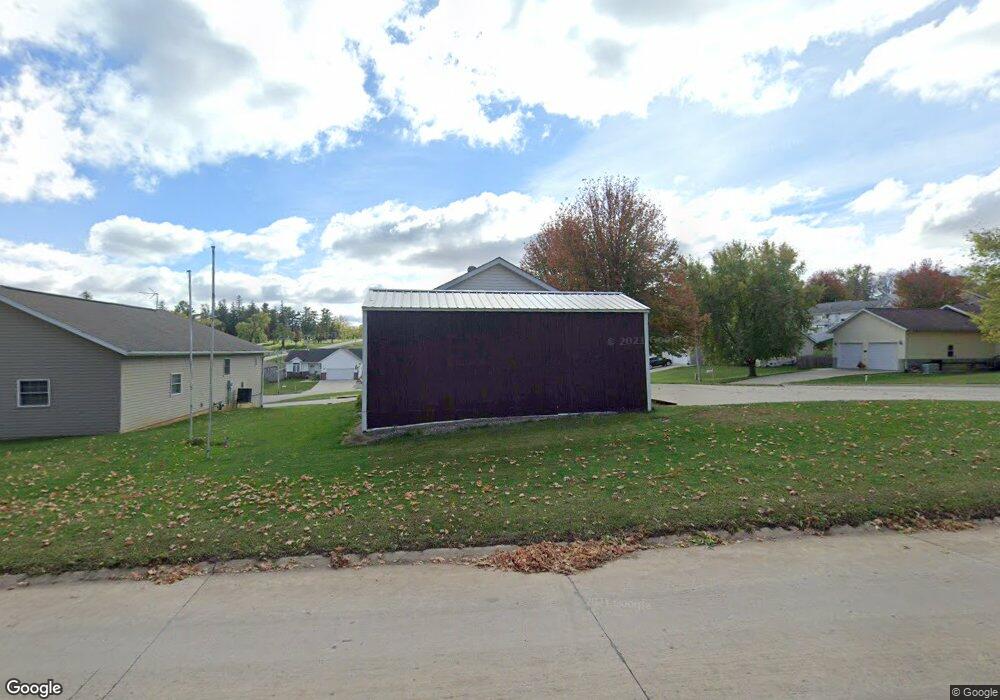
This home is located at 400 Jefferson St, Victor, IA 52347 and is currently estimated at $220,535, approximately $162 per square foot. 400 Jefferson St is a home located in Iowa County.
Ownership History
Date
Name
Owned For
Owner Type
Purchase Details
Closed on
Apr 9, 2021
Sold by
Drummy Thomas A
Bought by
Drummy Joseph E and Drummy Heidi E
Current Estimated Value
Purchase Details
Closed on
Apr 27, 2011
Sold by
Heitmann Russell and Heitmann Susan
Bought by
Deneve Lynn and Deneve Jennifer
Home Financials for this Owner
Home Financials are based on the most recent Mortgage that was taken out on this home.
Original Mortgage
$350,000
Outstanding Balance
$243,010
Interest Rate
4.86%
Mortgage Type
Future Advance Clause Open End Mortgage
Estimated Equity
-$22,475
Purchase Details
Closed on
Oct 2, 2009
Sold by
Deneve Richard H and Deneve Mary Elizabeth
Bought by
Deneve Lynn and Deneve Mary
Home Financials for this Owner
Home Financials are based on the most recent Mortgage that was taken out on this home.
Original Mortgage
$83,000
Interest Rate
5.07%
Mortgage Type
Stand Alone Refi Refinance Of Original Loan
Create a Home Valuation Report for This Property
The Home Valuation Report is an in-depth analysis detailing your home's value as well as a comparison with similar homes in the area
Home Values in the Area
Average Home Value in this Area
Purchase History
| Date | Buyer | Sale Price | Title Company |
|---|---|---|---|
| Drummy Joseph E | -- | None Available | |
| Deneve Lynn | $30,000 | None Available | |
| Deneve Lynn | $90,000 | None Available |
Source: Public Records
Mortgage History
| Date | Status | Borrower | Loan Amount |
|---|---|---|---|
| Open | Deneve Lynn | $350,000 | |
| Previous Owner | Deneve Lynn | $83,000 |
Source: Public Records
Tax History Compared to Growth
Tax History
| Year | Tax Paid | Tax Assessment Tax Assessment Total Assessment is a certain percentage of the fair market value that is determined by local assessors to be the total taxable value of land and additions on the property. | Land | Improvement |
|---|---|---|---|---|
| 2024 | $2,822 | $187,300 | $18,870 | $168,430 |
| 2023 | $2,616 | $187,300 | $18,870 | $168,430 |
| 2022 | $2,558 | $150,030 | $18,870 | $131,160 |
| 2021 | $2,862 | $150,030 | $18,870 | $131,160 |
| 2020 | $2,790 | $149,330 | $17,230 | $132,100 |
| 2019 | $3,351 | $149,330 | $17,230 | $132,100 |
| 2018 | $2,674 | $142,330 | $15,590 | $126,740 |
| 2017 | $2,532 | $142,330 | $15,590 | $126,740 |
| 2016 | $2,450 | $133,880 | $15,590 | $118,290 |
| 2015 | -- | $133,880 | $15,590 | $118,290 |
| 2014 | -- | $138,790 | $15,590 | $123,200 |
Source: Public Records
Map
Nearby Homes