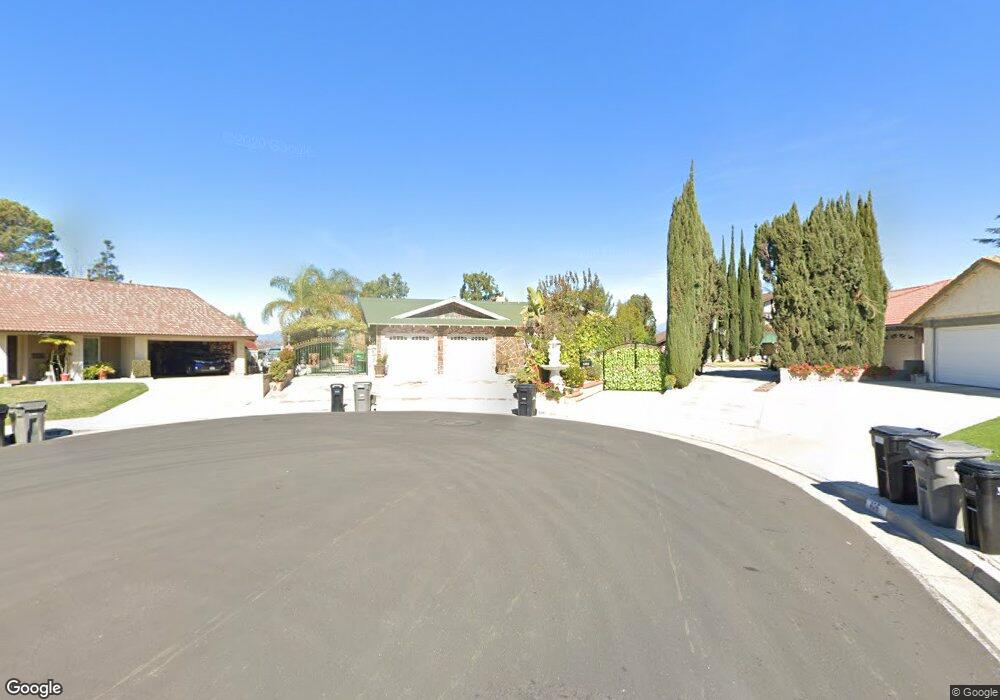
400 Laspino Ln Diamond Bar, CA 91765
Estimated Value: $928,000 - $1,074,000
3
Beds
3
Baths
1,840
Sq Ft
$533/Sq Ft
Est. Value
About This Home
This home is located at 400 Laspino Ln, Diamond Bar, CA 91765 and is currently estimated at $981,242, approximately $533 per square foot. 400 Laspino Ln is a home located in Los Angeles County with nearby schools including Golden Springs Elementary School, Lorbeer Middle School, and Diamond Ranch High School.
Ownership History
Date
Name
Owned For
Owner Type
Purchase Details
Closed on
Apr 3, 1998
Sold by
Milam Harold D
Bought by
Shen Chang Kang and Li Zhen Qin
Current Estimated Value
Home Financials for this Owner
Home Financials are based on the most recent Mortgage that was taken out on this home.
Original Mortgage
$165,600
Outstanding Balance
$31,573
Interest Rate
7.15%
Estimated Equity
$949,669
Purchase Details
Closed on
May 24, 1994
Sold by
Milam Barbara Dianne
Bought by
Milam Harold D
Home Financials for this Owner
Home Financials are based on the most recent Mortgage that was taken out on this home.
Original Mortgage
$188,100
Interest Rate
8.56%
Purchase Details
Closed on
Apr 22, 1994
Sold by
Seiler Robert G and Seiler Maizie C
Bought by
Milam Harold D
Home Financials for this Owner
Home Financials are based on the most recent Mortgage that was taken out on this home.
Original Mortgage
$188,100
Interest Rate
8.56%
Create a Home Valuation Report for This Property
The Home Valuation Report is an in-depth analysis detailing your home's value as well as a comparison with similar homes in the area
Home Values in the Area
Average Home Value in this Area
Purchase History
| Date | Buyer | Sale Price | Title Company |
|---|---|---|---|
| Shen Chang Kang | $207,000 | South Coast Title | |
| Milam Harold D | -- | Orange Coast Title | |
| Milam Harold D | $198,000 | Orange Coast Title |
Source: Public Records
Mortgage History
| Date | Status | Borrower | Loan Amount |
|---|---|---|---|
| Open | Shen Chang Kang | $165,600 | |
| Previous Owner | Milam Harold D | $188,100 |
Source: Public Records
Tax History Compared to Growth
Tax History
| Year | Tax Paid | Tax Assessment Tax Assessment Total Assessment is a certain percentage of the fair market value that is determined by local assessors to be the total taxable value of land and additions on the property. | Land | Improvement |
|---|---|---|---|---|
| 2025 | $4,732 | $344,823 | $183,455 | $161,368 |
| 2024 | $4,732 | $338,062 | $179,858 | $158,204 |
| 2023 | $4,595 | $331,434 | $176,332 | $155,102 |
| 2022 | $4,471 | $324,936 | $172,875 | $152,061 |
| 2021 | $4,368 | $318,566 | $169,486 | $149,080 |
| 2019 | $4,449 | $309,119 | $164,460 | $144,659 |
| 2018 | $4,088 | $303,059 | $161,236 | $141,823 |
| 2016 | $3,831 | $291,293 | $154,976 | $136,317 |
| 2015 | $3,798 | $286,919 | $152,649 | $134,270 |
| 2014 | $3,777 | $281,299 | $149,659 | $131,640 |
Source: Public Records
Map
Nearby Homes
- 437 Carpio Dr
- 454 Ballena Dr
- 330 Ballena Dr
- 529 Bregante Dr
- 23966 Decorah Rd
- 428 Golden Springs Dr Unit E
- 651 Radbury Place
- 547 Bellows Ct
- 683 Radbury Place
- 24232 Sylvan Glen Rd Unit A
- 536 N Del Sol Ln
- 760 Featherwood Dr
- 23817 Decorah Rd
- 24471 Rockbury Dr
- 23601 Golden Springs Dr
- 23659 Golden Springs Dr Unit 3F
- 23629 Golden Springs Dr Unit H-2
- 980 Golden Springs Dr Unit A
- 23675 Bower Cascade Place
- 1030 Golden Springs Dr Unit B