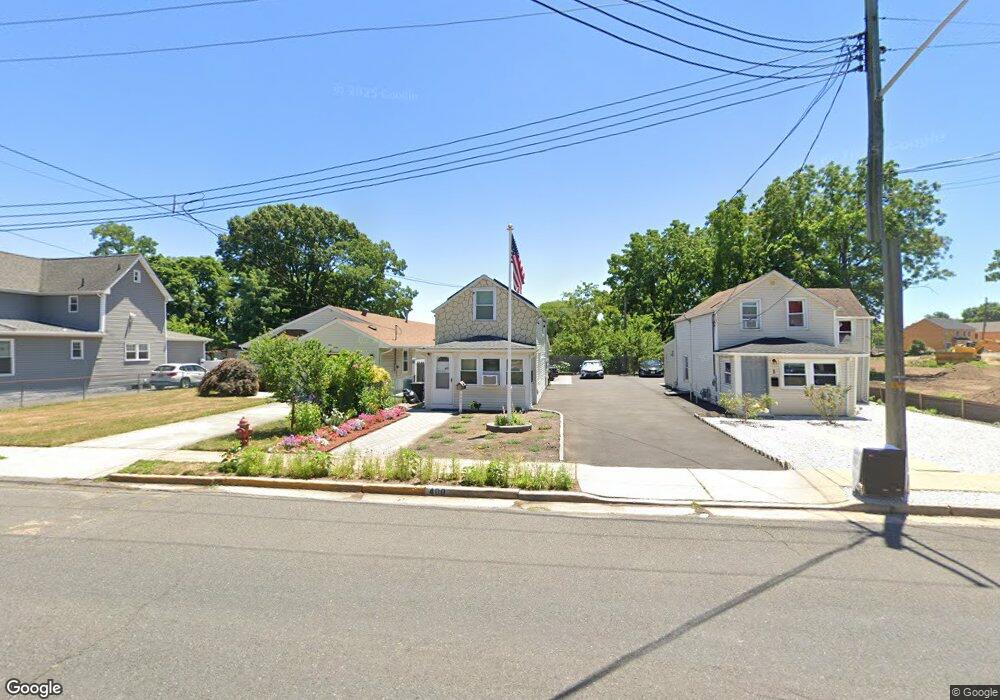
400 Maple Place Keyport, NJ 07735
Estimated Value: $334,000 - $345,531
2
Beds
1
Bath
837
Sq Ft
$408/Sq Ft
Est. Value
About This Home
This home is located at 400 Maple Place, Keyport, NJ 07735 and is currently estimated at $341,133, approximately $407 per square foot. 400 Maple Place is a home located in Monmouth County with nearby schools including Keyport Central School, Keyport High School, and St. Joseph Elementary School.
Ownership History
Date
Name
Owned For
Owner Type
Purchase Details
Closed on
Dec 21, 2015
Sold by
Walling Bruce
Bought by
Wisiak Terri
Current Estimated Value
Purchase Details
Closed on
Aug 27, 2010
Sold by
Estate Of Phyllis M Gorman and Gorman John J
Bought by
Walling Bruce
Home Financials for this Owner
Home Financials are based on the most recent Mortgage that was taken out on this home.
Original Mortgage
$135,968
Interest Rate
4.87%
Mortgage Type
FHA
Purchase Details
Closed on
May 12, 2009
Sold by
Gorman John and Gorman Phyllis
Bought by
Gorman Phyllis
Purchase Details
Closed on
Jul 16, 2004
Sold by
Fletcher Thomas
Bought by
Gorman John and Gorman Phyllis
Purchase Details
Closed on
Oct 17, 2001
Sold by
Richard Daniel
Bought by
Rehbori Deborah
Home Financials for this Owner
Home Financials are based on the most recent Mortgage that was taken out on this home.
Original Mortgage
$105,750
Interest Rate
6.92%
Purchase Details
Closed on
Jun 8, 2000
Sold by
Limbach Vivian
Bought by
Richard Daniel
Create a Home Valuation Report for This Property
The Home Valuation Report is an in-depth analysis detailing your home's value as well as a comparison with similar homes in the area
Home Values in the Area
Average Home Value in this Area
Purchase History
| Date | Buyer | Sale Price | Title Company |
|---|---|---|---|
| Wisiak Terri | $138,360 | None Available | |
| Walling Bruce | $137,800 | Acres Land Title Agency Llc | |
| Gorman Phyllis | -- | None Available | |
| Gorman John | $152,000 | -- | |
| Rehbori Deborah | $117,500 | -- | |
| Richard Daniel | $55,000 | -- |
Source: Public Records
Mortgage History
| Date | Status | Borrower | Loan Amount |
|---|---|---|---|
| Previous Owner | Walling Bruce | $135,968 | |
| Previous Owner | Rehbori Deborah | $105,750 |
Source: Public Records
Tax History Compared to Growth
Tax History
| Year | Tax Paid | Tax Assessment Tax Assessment Total Assessment is a certain percentage of the fair market value that is determined by local assessors to be the total taxable value of land and additions on the property. | Land | Improvement |
|---|---|---|---|---|
| 2025 | $5,003 | $276,100 | $161,700 | $114,400 |
| 2024 | $4,798 | $241,700 | $132,900 | $108,800 |
| 2023 | $4,798 | $218,300 | $115,600 | $102,700 |
| 2022 | $4,152 | $189,800 | $100,500 | $89,300 |
| 2021 | $4,152 | $164,500 | $93,100 | $71,400 |
| 2020 | $4,000 | $157,300 | $89,400 | $67,900 |
| 2019 | $3,867 | $152,300 | $85,900 | $66,400 |
| 2018 | $3,676 | $141,400 | $79,300 | $62,100 |
| 2017 | $3,707 | $142,200 | $80,900 | $61,300 |
| 2016 | $3,596 | $139,100 | $80,900 | $58,200 |
| 2015 | $3,212 | $133,300 | $75,900 | $57,400 |
| 2014 | $2,852 | $120,600 | $50,900 | $69,700 |
Source: Public Records
Map
Nearby Homes
- 22 Lower Main St
- 324 Maple Place
- 52 Highway 35
- 1 Hobart St
- 253 Broadway
- 557 Lloyd Rd Unit B
- 127 Chingarora Ave
- 23 Mathiasen Place
- 154 Lower Main St
- 14 Dolan Ave
- 369 Riverdale Dr
- 95 Broadway
- 8 Chingarora Ave
- 90 Saint Peters Place
- 9 Monmouth Place
- 47 Village Green Way
- 46 Parkview Dr
- 39-41 Atlantic Ave
- 34 Oak Knoll Dr
- 18 Oak Knoll Dr
- 1 Lower Main St
- 392 Maple Place
- 396 Maple Place
- 10 Lower Main St
- 12 Lower Main St
- 381 Maple Place
- 14 Lower Main St
- 16 Lower Main St
- 16 Lower Main St Unit 9
- 377 Maple Place
- 18 Lower Main St
- 17 Lower Main St
- 301 Ryan St
- 303 Ryan St
- 305 Ryan St
- 20 Lower Main St
- 307 Ryan St
- 21 Lower Main St
- 50 Gaston St
- 309 Ryan St