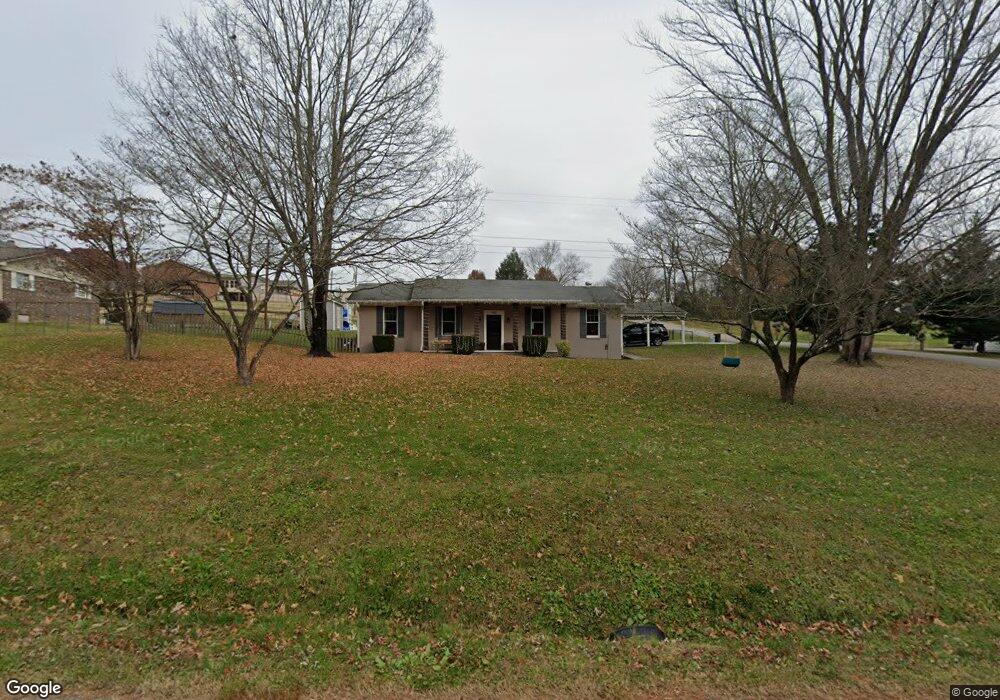
400 Myers St Jacksboro, TN 37757
Estimated Value: $263,727 - $396,000
Studio
2
Baths
1,867
Sq Ft
$184/Sq Ft
Est. Value
About This Home
This home is located at 400 Myers St, Jacksboro, TN 37757 and is currently estimated at $344,182, approximately $184 per square foot. 400 Myers St is a home located in Campbell County with nearby schools including Calvary Christian Academy.
Ownership History
Date
Name
Owned For
Owner Type
Purchase Details
Closed on
May 8, 2014
Sold by
Nance Kolby J
Bought by
Price Matthew
Current Estimated Value
Home Financials for this Owner
Home Financials are based on the most recent Mortgage that was taken out on this home.
Original Mortgage
$110,000
Outstanding Balance
$83,715
Interest Rate
4.37%
Mortgage Type
New Conventional
Estimated Equity
$260,467
Purchase Details
Closed on
Jan 11, 2013
Sold by
The Derick And Kolby J Nan
Bought by
Nance Kolby J and Nance Megan R
Purchase Details
Closed on
May 15, 1989
Bought by
Nance Derick and Nance Cynthia
Purchase Details
Closed on
Mar 14, 1989
Bought by
Transouth Financial Corp
Purchase Details
Closed on
Apr 20, 1983
Bought by
Wilson Glenn
Purchase Details
Closed on
Dec 27, 1977
Bought by
Wilson Dexter
Purchase Details
Closed on
Nov 8, 1976
Bought by
Marlow Jerry
Purchase Details
Closed on
Nov 20, 1975
Bought by
Tucker J Harold
Purchase Details
Closed on
Jan 1, 1973
Create a Home Valuation Report for This Property
The Home Valuation Report is an in-depth analysis detailing your home's value as well as a comparison with similar homes in the area
Home Values in the Area
Average Home Value in this Area
Purchase History
| Date | Buyer | Sale Price | Title Company |
|---|---|---|---|
| Price Matthew | $150,000 | -- | |
| Nance Kolby J | -- | -- | |
| Nance Derick | $47,300 | -- | |
| Transouth Financial Corp | $33,000 | -- | |
| Wilson Glenn | -- | -- | |
| Wilson Dexter | -- | -- | |
| Marlow Jerry | -- | -- | |
| Tucker J Harold | -- | -- | |
| -- | -- | -- |
Source: Public Records
Mortgage History
| Date | Status | Borrower | Loan Amount |
|---|---|---|---|
| Open | Price Matthew | $110,000 |
Source: Public Records
Tax History
| Year | Tax Paid | Tax Assessment Tax Assessment Total Assessment is a certain percentage of the fair market value that is determined by local assessors to be the total taxable value of land and additions on the property. | Land | Improvement |
|---|---|---|---|---|
| 2025 | -- | $67,550 | $7,225 | $60,325 |
| 2024 | -- | $67,550 | $7,225 | $60,325 |
| 2023 | $825 | $39,950 | $5,650 | $34,300 |
| 2022 | $825 | $39,950 | $5,650 | $34,300 |
| 2021 | $825 | $39,950 | $5,650 | $34,300 |
| 2020 | $809 | $39,950 | $5,650 | $34,300 |
| 2019 | $825 | $39,950 | $5,650 | $34,300 |
| 2018 | $810 | $36,000 | $5,250 | $30,750 |
| 2017 | $810 | $36,000 | $5,250 | $30,750 |
| 2016 | $810 | $36,000 | $5,250 | $30,750 |
| 2015 | $716 | $36,000 | $5,250 | $30,750 |
| 2014 | $716 | $36,000 | $5,250 | $30,750 |
| 2013 | -- | $36,000 | $5,250 | $30,750 |
Source: Public Records
Map
Nearby Homes
- 116 Oak St
- Lots 9&10 Woodvine St
- 224 Mountain View Rd
- 775 Butter and Egg Rd
- 115 Sam William Ln
- 180 Cedar Ln
- 211 Evans Rd
- 280 Tionesta Dr
- 0 Hilltop Dr
- 491 Tionesta Dr
- 149 Island Ford Rd
- 127 Water St
- 112 Margaret Ln
- 163 Mineral Springs Ln
- 0 Mountain Perkins Ln Unit 1322756
- 217 Eagle View Ln
- 187 Eagle View Ln
- 207 Eagle View Ln
- 227 Eagle View Ln
- 147 Eagle View Ln
Your Personal Tour Guide
Ask me questions while you tour the home.