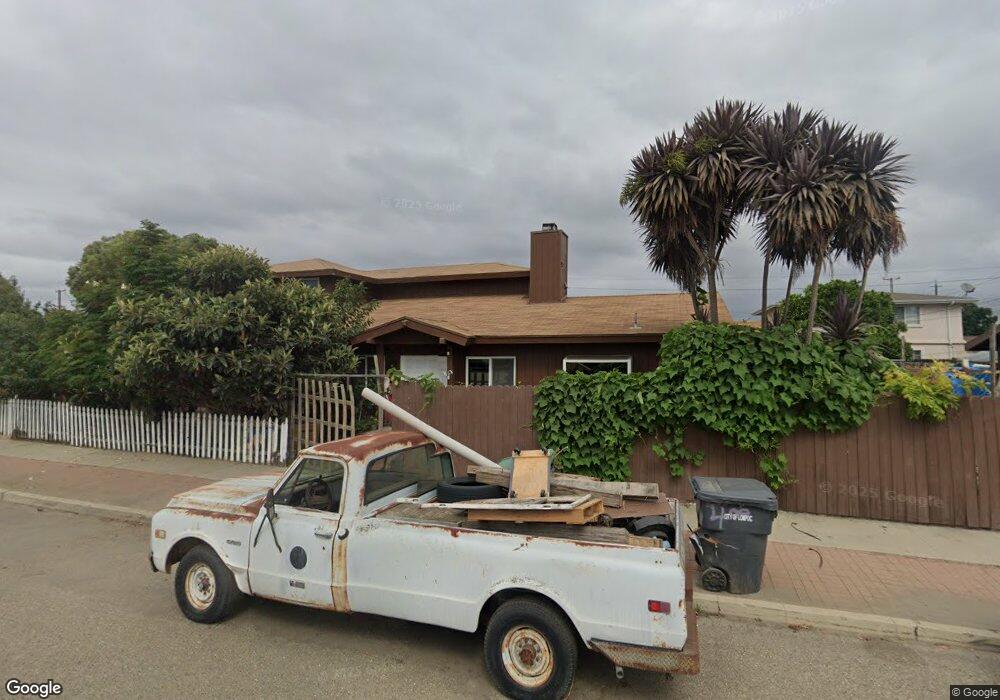
400 N G St Lompoc, CA 93436
Estimated Value: $610,000 - $669,032
3
Beds
2
Baths
2,546
Sq Ft
$255/Sq Ft
Est. Value
About This Home
This home is located at 400 N G St, Lompoc, CA 93436 and is currently estimated at $650,258, approximately $255 per square foot. 400 N G St is a home located in Santa Barbara County with nearby schools including Arthur Hapgood Elementary School, Lompoc Valley Middle School, and Lompoc High School.
Ownership History
Date
Name
Owned For
Owner Type
Purchase Details
Closed on
Mar 28, 2016
Sold by
Brodhead Charles Lindbergh and Brodhead Doris E
Bought by
Morss Duane and Morss Griselda
Current Estimated Value
Home Financials for this Owner
Home Financials are based on the most recent Mortgage that was taken out on this home.
Original Mortgage
$331,386
Interest Rate
3.25%
Mortgage Type
FHA
Purchase Details
Closed on
Jun 3, 2009
Sold by
Brodhead Charles Lindbergh
Bought by
Brodhead Charles Lindbergh and Brodhead Doris E
Home Financials for this Owner
Home Financials are based on the most recent Mortgage that was taken out on this home.
Original Mortgage
$312,000
Interest Rate
4.76%
Mortgage Type
VA
Purchase Details
Closed on
May 28, 2009
Sold by
Brodhead Doris E
Bought by
Brodhead Charles Lindbergh
Home Financials for this Owner
Home Financials are based on the most recent Mortgage that was taken out on this home.
Original Mortgage
$312,000
Interest Rate
4.76%
Mortgage Type
VA
Purchase Details
Closed on
May 18, 2009
Sold by
Anderson Eugene Frank and Anderson Jane
Bought by
Brodhead Charles Lindbergh
Home Financials for this Owner
Home Financials are based on the most recent Mortgage that was taken out on this home.
Original Mortgage
$312,000
Interest Rate
4.76%
Mortgage Type
VA
Purchase Details
Closed on
Dec 10, 2007
Sold by
Anderson Eugene Frank and Anderson Jane
Bought by
Anderson Eugene Frank and Anderson Jane
Home Financials for this Owner
Home Financials are based on the most recent Mortgage that was taken out on this home.
Original Mortgage
$200,000
Interest Rate
5.87%
Mortgage Type
New Conventional
Purchase Details
Closed on
Jan 27, 1995
Sold by
Anderson Jane F
Bought by
Anderson Eugene Frank
Home Financials for this Owner
Home Financials are based on the most recent Mortgage that was taken out on this home.
Original Mortgage
$75,000
Interest Rate
8.8%
Create a Home Valuation Report for This Property
The Home Valuation Report is an in-depth analysis detailing your home's value as well as a comparison with similar homes in the area
Home Values in the Area
Average Home Value in this Area
Purchase History
| Date | Buyer | Sale Price | Title Company |
|---|---|---|---|
| Morss Duane | $337,500 | Fidelity National Title Co | |
| Brodhead Charles Lindbergh | -- | Chicago Title Company | |
| Brodhead Charles Lindbergh | -- | Chicago Title Company | |
| Brodhead Charles Lindbergh | $312,000 | Chicago Title Company | |
| Anderson Eugene Frank | -- | Accommodation | |
| Anderson Eugene Frank | -- | Southland Title Company | |
| Anderson Eugene Frank | -- | First American Title |
Source: Public Records
Mortgage History
| Date | Status | Borrower | Loan Amount |
|---|---|---|---|
| Previous Owner | Morss Duane | $331,386 | |
| Previous Owner | Brodhead Charles Lindbergh | $312,000 | |
| Previous Owner | Anderson Eugene Frank | $200,000 | |
| Previous Owner | Anderson Eugene Frank | $75,000 |
Source: Public Records
Tax History
| Year | Tax Paid | Tax Assessment Tax Assessment Total Assessment is a certain percentage of the fair market value that is determined by local assessors to be the total taxable value of land and additions on the property. | Land | Improvement |
|---|---|---|---|---|
| 2025 | $4,358 | $399,523 | $94,699 | $304,824 |
| 2023 | $4,358 | $384,012 | $91,023 | $292,989 |
| 2022 | $4,283 | $376,484 | $89,239 | $287,245 |
| 2021 | $4,331 | $369,103 | $87,490 | $281,613 |
| 2020 | $4,285 | $365,319 | $86,593 | $278,726 |
| 2019 | $4,215 | $358,157 | $84,896 | $273,261 |
| 2018 | $4,150 | $351,135 | $83,232 | $267,903 |
| 2017 | $4,074 | $344,250 | $81,600 | $262,650 |
| 2016 | $4,001 | $337,500 | $80,000 | $257,500 |
| 2015 | $2,499 | $334,298 | $117,861 | $216,437 |
| 2014 | $2,452 | $327,751 | $115,553 | $212,198 |
Source: Public Records
Map
Nearby Homes
- 533 N G St
- 510 N I St
- 801, 851 California 246
- 526 N L St
- 117 S I St
- 113 N B St
- 622 N B St
- 610 E Pine Ave Unit 10
- 610 E Pine Ave Unit 29
- 610 E Pine Ave Unit 62
- 505 N 1st St
- 205 S E St
- 217 N M St
- 215 S H St
- 240 Quail Cir
- 321 N Third St
- 701 E Pine Ave Unit 182
- 701 E Pine Ave Unit 176
- 701 E Pine Ave Unit 171
- 701 E Pine Ave Unit 161
Your Personal Tour Guide
Ask me questions while you tour the home.