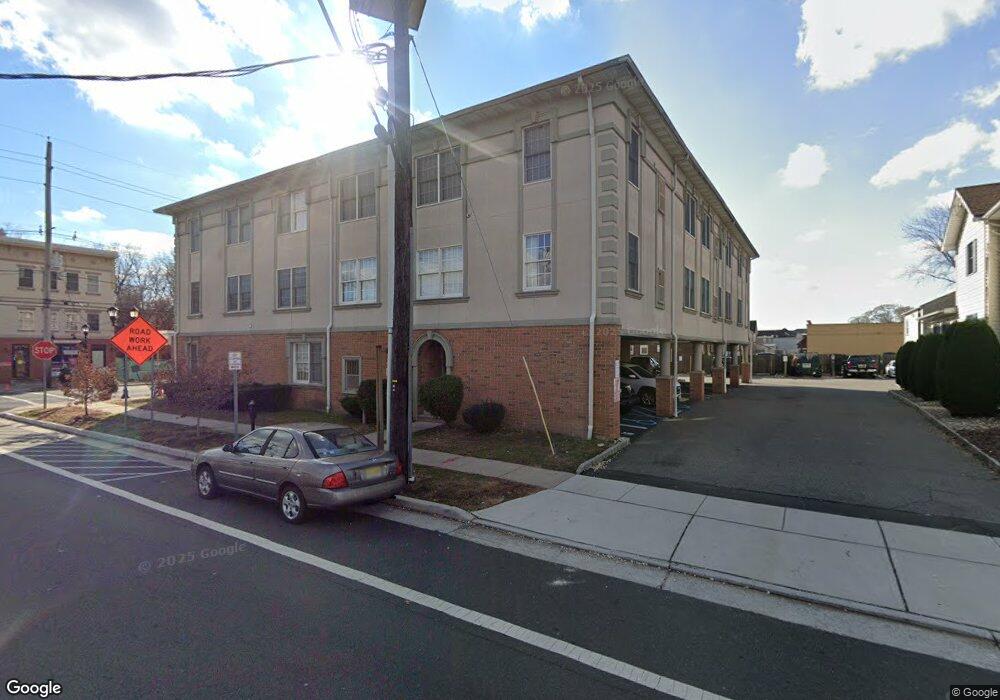
400 North Ave Unit 17 Dunellen, NJ 08812
Estimated Value: $277,949 - $312,000
1
Bed
--
Bath
913
Sq Ft
$323/Sq Ft
Est. Value
About This Home
This home is located at 400 North Ave Unit 17, Dunellen, NJ 08812 and is currently estimated at $295,237, approximately $323 per square foot. 400 North Ave Unit 17 is a home located in Middlesex County with nearby schools including John P. Faber Elementary School, Lincoln Middle School, and Dunellen High School.
Ownership History
Date
Name
Owned For
Owner Type
Purchase Details
Closed on
Dec 11, 2020
Sold by
Rozario Simon and Rozario Gitasri
Bought by
Hopkins Keith M
Current Estimated Value
Home Financials for this Owner
Home Financials are based on the most recent Mortgage that was taken out on this home.
Original Mortgage
$134,400
Outstanding Balance
$119,656
Interest Rate
2.7%
Mortgage Type
New Conventional
Estimated Equity
$175,581
Purchase Details
Closed on
Sep 12, 2017
Sold by
Rozario Simon
Bought by
Rozario Simon and Rozario Gitasri
Home Financials for this Owner
Home Financials are based on the most recent Mortgage that was taken out on this home.
Original Mortgage
$136,000
Interest Rate
3.82%
Mortgage Type
New Conventional
Purchase Details
Closed on
Jul 29, 2013
Sold by
Ferguson Christina
Bought by
Rozario Simon
Home Financials for this Owner
Home Financials are based on the most recent Mortgage that was taken out on this home.
Original Mortgage
$158,650
Interest Rate
4.45%
Mortgage Type
New Conventional
Create a Home Valuation Report for This Property
The Home Valuation Report is an in-depth analysis detailing your home's value as well as a comparison with similar homes in the area
Home Values in the Area
Average Home Value in this Area
Purchase History
| Date | Buyer | Sale Price | Title Company |
|---|---|---|---|
| Hopkins Keith M | $168,000 | Premier Abstract & Ttl Agcy | |
| Rozario Simon | -- | Max Title Agency Llc | |
| Rozario Simon | $167,000 | Agnet For Old Republic Nat |
Source: Public Records
Mortgage History
| Date | Status | Borrower | Loan Amount |
|---|---|---|---|
| Open | Hopkins Keith M | $134,400 | |
| Previous Owner | Rozario Simon | $136,000 | |
| Previous Owner | Rozario Simon | $158,650 |
Source: Public Records
Tax History Compared to Growth
Tax History
| Year | Tax Paid | Tax Assessment Tax Assessment Total Assessment is a certain percentage of the fair market value that is determined by local assessors to be the total taxable value of land and additions on the property. | Land | Improvement |
|---|---|---|---|---|
| 2025 | $4,763 | $216,100 | $30,000 | $186,100 |
| 2024 | $4,864 | $189,900 | $30,000 | $159,900 |
| 2023 | $4,864 | $179,600 | $30,000 | $149,600 |
| 2022 | $4,815 | $174,400 | $30,000 | $144,400 |
| 2021 | $5,052 | $161,600 | $30,000 | $131,600 |
| 2020 | $5,288 | $162,800 | $45,000 | $117,800 |
| 2019 | $5,052 | $162,800 | $45,000 | $117,800 |
| 2018 | $5,375 | $39,800 | $16,500 | $23,300 |
| 2017 | $5,158 | $39,800 | $16,500 | $23,300 |
| 2016 | $4,970 | $39,800 | $16,500 | $23,300 |
| 2015 | $4,846 | $39,800 | $16,500 | $23,300 |
| 2014 | $4,743 | $39,800 | $16,500 | $23,300 |
Source: Public Records
Map
Nearby Homes
- 202 Prospect Ave
- 511 Grove St
- 417 2nd St
- 325 Orange St
- 250 Whittier Ave
- 577 S South Ave S
- 518 2nd St
- 220 S Washington Ave
- 203 S Washington Ave
- 705 Front St
- 711 Dunellen Ave
- 709 Front St
- 309-311 Pulaski St
- 261 New Market Rd
- 314 3rd St
- 323 Oak Pkwy
- 403 Jackson Ave
- 529 4th St
- 143 1st St
- 742 Dunellen Ave
- 400 North Ave Unit 11
- 400 North Ave Unit 16
- 400 North Ave Unit 7
- 400 North Ave Unit 10
- 400 North Ave Unit 1
- 400 North Ave Unit 9
- 400 North Ave Unit 8
- 400 North Ave Unit 6
- 400 North Ave Unit 5
- 400 North Ave Unit 4
- 400 North Ave Unit 3
- 400 North Ave Unit 2
- 400 North Ave Unit 18
- 400 North Ave Unit 15
- 400 North Ave Unit 14
- 400 North Ave Unit 13
- 400 North Ave Unit 12
- 400 North Ave
- 400 North Ave Unit C
- 400 N Avenue 16