Estimated Value: $252,225 - $266,000
3
Beds
2
Baths
1,842
Sq Ft
$142/Sq Ft
Est. Value
About This Home
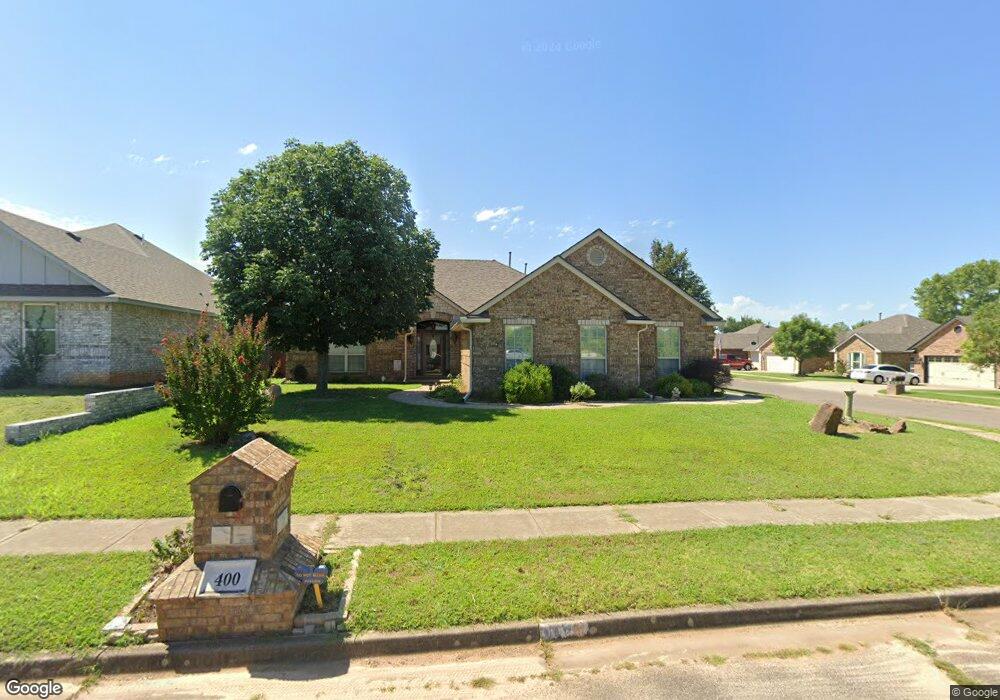
This home is located at 400 Rolling Meadow, Noble, OK 73068 and is currently estimated at $260,806, approximately $141 per square foot. 400 Rolling Meadow is a home located in Cleveland County with nearby schools including Katherine I. Daily Elementary School, Pioneer Intermediate Elementary School, and John K. Hubbard Elementary School.
Ownership History
Date
Name
Owned For
Owner Type
Purchase Details
Closed on
Feb 28, 2017
Sold by
Self Reginald D and Self Vonna J
Bought by
Richardson Lindsey M
Current Estimated Value
Home Financials for this Owner
Home Financials are based on the most recent Mortgage that was taken out on this home.
Original Mortgage
$172,900
Outstanding Balance
$143,058
Interest Rate
4.09%
Mortgage Type
New Conventional
Estimated Equity
$117,748
Purchase Details
Closed on
Sep 27, 2005
Sold by
Rolling Meadows Developers Llc
Bought by
Self Reginald D and Self Vonna J
Home Financials for this Owner
Home Financials are based on the most recent Mortgage that was taken out on this home.
Original Mortgage
$120,000
Interest Rate
5.76%
Mortgage Type
Future Advance Clause Open End Mortgage
Create a Home Valuation Report for This Property
The Home Valuation Report is an in-depth analysis detailing your home's value as well as a comparison with similar homes in the area
Home Values in the Area
Average Home Value in this Area
Purchase History
| Date | Buyer | Sale Price | Title Company |
|---|---|---|---|
| Richardson Lindsey M | $182,000 | None Available | |
| Self Reginald D | $18,500 | None Available |
Source: Public Records
Mortgage History
| Date | Status | Borrower | Loan Amount |
|---|---|---|---|
| Open | Richardson Lindsey M | $172,900 | |
| Previous Owner | Self Reginald D | $120,000 |
Source: Public Records
Tax History Compared to Growth
Tax History
| Year | Tax Paid | Tax Assessment Tax Assessment Total Assessment is a certain percentage of the fair market value that is determined by local assessors to be the total taxable value of land and additions on the property. | Land | Improvement |
|---|---|---|---|---|
| 2024 | $2,434 | $21,698 | $2,912 | $18,786 |
| 2023 | $2,395 | $21,066 | $2,955 | $18,111 |
| 2022 | $2,271 | $20,452 | $2,818 | $17,634 |
| 2021 | $2,094 | $19,857 | $1,440 | $18,417 |
| 2020 | $2,176 | $20,295 | $1,440 | $18,855 |
| 2019 | $2,231 | $20,202 | $1,440 | $18,762 |
| 2018 | $2,230 | $20,352 | $1,440 | $18,912 |
| 2017 | $1,947 | $18,581 | $0 | $0 |
| 2016 | $1,965 | $18,581 | $1,440 | $17,141 |
| 2015 | $1,902 | $18,581 | $1,440 | $17,141 |
| 2014 | $1,863 | $18,581 | $1,440 | $17,141 |
Source: Public Records
Map
Nearby Homes
- 340 Treyton Place
- 604 Woodbriar
- 705 Rolling Meadow Dr
- 1216 N 4th St
- 609 Meadowlake Dr
- 905 Aspen Ct Unit 907
- 901 Acacia Cir Unit 903
- 805 Condor Ct
- 811 E Etowah Rd
- 400 N 5th St
- 411 Riverview Dr
- 1271 Haley Cir
- 0 R0069122 Unplatted S 2 Sw 4 Nw 4 N E 4 Unit 1144599
- 000 Willow Bend Rd
- 4321 E Etowah Rd
- 209 Juniper Cir
- 4081 Cedar Farm Rd
- 208 Camellia Cir
- 1102 Azalea Farms Rd
- 1104 Azalea Farms Rd
- 404 Rolling Meadow
- 401 Sequoyah Dr
- 408 Rolling Meadow
- 405 Sequoyah Dr
- 1404 Lexi Ln
- 1408 Lexi Ln
- 1415 Lexi Ln
- 1400 Lexi Ln
- 409 Sequoyah Dr
- 1412 Lexi Ln
- 412 Rolling Meadow
- 1316 Lexi Ln
- 1416 Lexi Ln
- 413 Sequoyah Dr
- 1416 Tiffany Ct
- 1312 Lexi Ln
- 416 Rolling Meadow
- 400 Sequoyah Dr
- 404 Sequoyah Dr
- 417 Sequoyah Dr