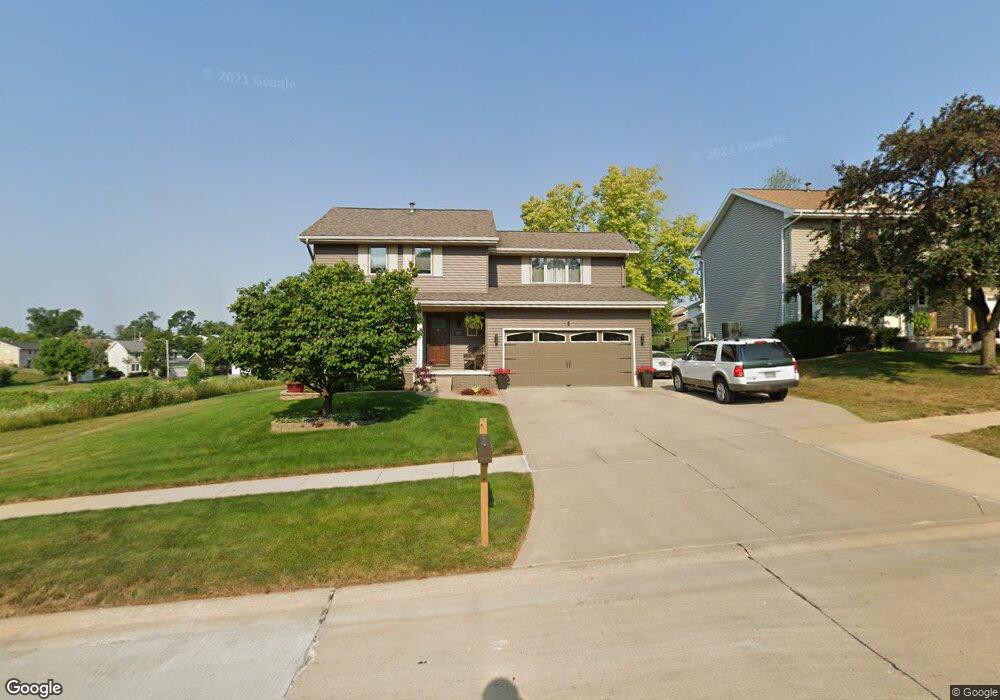
400 Shetland Dr NW Cedar Rapids, IA 52405
Cherry Hill Park NeighborhoodEstimated Value: $287,000 - $306,000
3
Beds
3
Baths
1,682
Sq Ft
$176/Sq Ft
Est. Value
About This Home
This home is located at 400 Shetland Dr NW, Cedar Rapids, IA 52405 and is currently estimated at $296,842, approximately $176 per square foot. 400 Shetland Dr NW is a home located in Linn County with nearby schools including Junction City Elementary School, Hoover Elementary School, and Kentucky Tech - Ashland Reg Tech Center.
Ownership History
Date
Name
Owned For
Owner Type
Purchase Details
Closed on
Mar 28, 2023
Sold by
Sturtz Amy A and Sturtz Amy E
Bought by
Bruzek Tyler A and Bruzek Alicia L
Current Estimated Value
Home Financials for this Owner
Home Financials are based on the most recent Mortgage that was taken out on this home.
Original Mortgage
$221,000
Outstanding Balance
$214,536
Interest Rate
6.32%
Mortgage Type
New Conventional
Estimated Equity
$82,306
Purchase Details
Closed on
Dec 1, 2005
Sold by
Solyntjes Scott Thomas
Bought by
Sturtz Michael A and Sturtz Amy E
Home Financials for this Owner
Home Financials are based on the most recent Mortgage that was taken out on this home.
Original Mortgage
$138,800
Interest Rate
6.17%
Mortgage Type
Fannie Mae Freddie Mac
Purchase Details
Closed on
Jan 29, 2003
Sold by
Solyntjes Mary Leone
Bought by
Solyntjes Scott Thomas
Home Financials for this Owner
Home Financials are based on the most recent Mortgage that was taken out on this home.
Original Mortgage
$147,150
Interest Rate
6.06%
Create a Home Valuation Report for This Property
The Home Valuation Report is an in-depth analysis detailing your home's value as well as a comparison with similar homes in the area
Home Values in the Area
Average Home Value in this Area
Purchase History
| Date | Buyer | Sale Price | Title Company |
|---|---|---|---|
| Bruzek Tyler A | $261,000 | -- | |
| Sturtz Michael A | $173,000 | -- | |
| Solyntjes Scott Thomas | -- | -- |
Source: Public Records
Mortgage History
| Date | Status | Borrower | Loan Amount |
|---|---|---|---|
| Open | Bruzek Tyler A | $221,000 | |
| Previous Owner | Sturtz Michael A | $138,800 | |
| Previous Owner | Solyntjes Scott Thomas | $147,150 |
Source: Public Records
Tax History Compared to Growth
Tax History
| Year | Tax Paid | Tax Assessment Tax Assessment Total Assessment is a certain percentage of the fair market value that is determined by local assessors to be the total taxable value of land and additions on the property. | Land | Improvement |
|---|---|---|---|---|
| 2025 | $4,514 | $274,600 | $50,500 | $224,100 |
| 2024 | $4,610 | $269,900 | $50,500 | $219,400 |
| 2023 | $4,610 | $265,600 | $50,500 | $215,100 |
| 2022 | $3,970 | $227,400 | $45,100 | $182,300 |
| 2021 | $4,096 | $200,600 | $39,700 | $160,900 |
| 2020 | $4,096 | $194,200 | $39,700 | $154,500 |
| 2019 | $3,574 | $174,300 | $28,900 | $145,400 |
| 2018 | $3,470 | $174,300 | $28,900 | $145,400 |
| 2017 | $3,649 | $184,300 | $28,900 | $155,400 |
| 2016 | $3,649 | $171,700 | $28,900 | $142,800 |
| 2015 | $3,521 | $165,506 | $32,468 | $133,038 |
| 2014 | $3,336 | $174,626 | $32,468 | $142,158 |
| 2013 | $3,450 | $174,626 | $32,468 | $142,158 |
Source: Public Records
Map
Nearby Homes
- 208 Lenora Dr NW
- 4819 Ford Ave NW
- 272 Peace Ave NW
- 229 Jacolyn Dr NW
- 281 Jacolyn Dr NW
- 3600 Midway Dr NW
- 4819 Fruitwood Ln NW
- 4910 Gordon Ave NW
- 4975 Kesler Rd NW
- 3509 E Ave NW Unit D
- 3507 E Ave NW Unit F
- 56 Julia Ann Dr NW
- 5127 Holly Ave NW
- 211 Edgewood Rd NW
- 327 NW Edgewood Rd Unit 324, 330, 336, 342 C
- 1410 Adair Ct SW Unit Lot 2
- 201 Edgewood Rd NW
- 3416 Sue Ln NW
- 4622 1st Ave NW Unit E
- 3312 G Ave NW
- 406 Shetland Dr NW
- 4227 Pearl Ave NW
- 4221 Pearl Ave NW
- 4217 Pearl Ave NW
- 319 Bezdek Dr NW
- 4305 Pearl Ave NW
- 405 Shetland Dr NW
- 345 Shetland Dr NW
- 325 Bezdek Dr NW
- 337 Shetland Dr NW
- 4311 Pearl Ave NW
- 411 Shetland Dr NW
- 331 Shetland Dr NW
- 417 Shetland Dr NW
- 333 Bezdek Dr NW
- 4317 Pearl Ave NW
- 323 Shetland Dr NW
- 4226 Pearl Ave NW
- 4220 Pearl Ave NW
- 400 Wiley Blvd NW