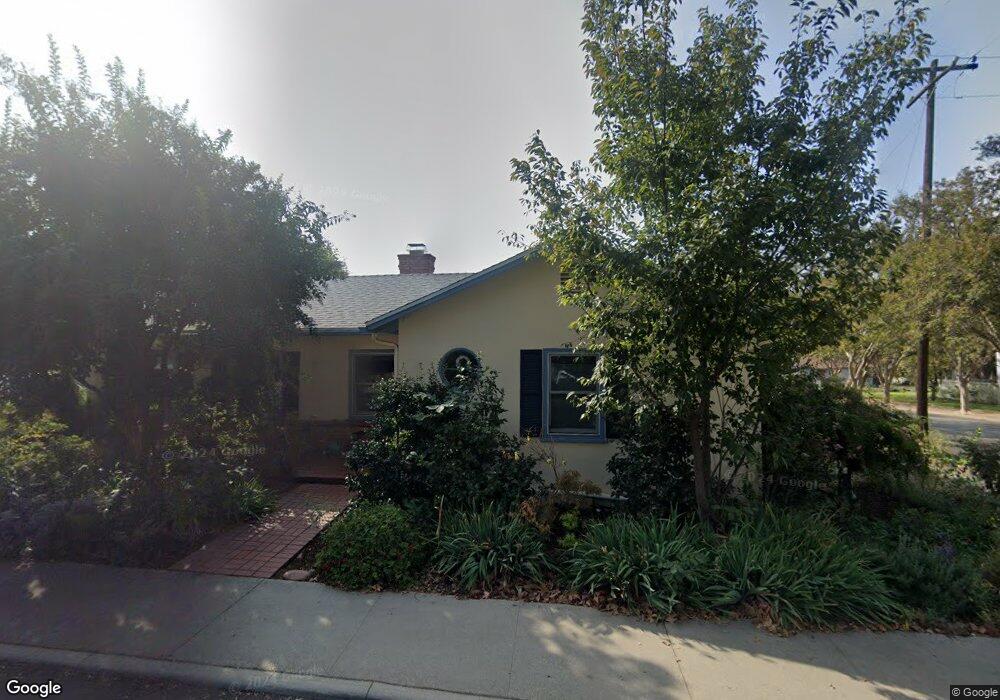
400 University Cir Claremont, CA 91711
Old Claremont NeighborhoodEstimated Value: $968,000 - $1,240,000
2
Beds
2
Baths
1,768
Sq Ft
$597/Sq Ft
Est. Value
About This Home
This home is located at 400 University Cir, Claremont, CA 91711 and is currently estimated at $1,055,503, approximately $597 per square foot. 400 University Cir is a home located in Los Angeles County with nearby schools including Sycamore Elementary School, El Roble Intermediate School, and Claremont High School.
Ownership History
Date
Name
Owned For
Owner Type
Purchase Details
Closed on
Jul 9, 2012
Sold by
Kay Mark W and Zukowski Christine
Bought by
Kay Mark and Zukowski Christine
Current Estimated Value
Purchase Details
Closed on
May 6, 2010
Sold by
Elsbree Langdon and Elsbree Aimee D
Bought by
Kay Mark W and Zukowski Christine
Home Financials for this Owner
Home Financials are based on the most recent Mortgage that was taken out on this home.
Original Mortgage
$150,000
Interest Rate
5.05%
Mortgage Type
New Conventional
Purchase Details
Closed on
Jul 1, 1998
Sold by
Elsbree Langdon and Elsbree Aimee D
Bought by
Elsbree Langdon and Elsbree Aimee D
Home Financials for this Owner
Home Financials are based on the most recent Mortgage that was taken out on this home.
Original Mortgage
$111,100
Interest Rate
7.1%
Purchase Details
Closed on
May 20, 1998
Sold by
Price Margaret C
Bought by
Elsbree Langdon and Elsbree Aimee D
Home Financials for this Owner
Home Financials are based on the most recent Mortgage that was taken out on this home.
Original Mortgage
$111,100
Interest Rate
7.1%
Create a Home Valuation Report for This Property
The Home Valuation Report is an in-depth analysis detailing your home's value as well as a comparison with similar homes in the area
Home Values in the Area
Average Home Value in this Area
Purchase History
| Date | Buyer | Sale Price | Title Company |
|---|---|---|---|
| Kay Mark | -- | None Available | |
| Kay Mark W | $500,000 | Orange Coast Title | |
| Elsbree Langdon | -- | -- | |
| Elsbree Langdon | $201,818 | Fidelity National Title Ins |
Source: Public Records
Mortgage History
| Date | Status | Borrower | Loan Amount |
|---|---|---|---|
| Closed | Kay Mark W | $150,000 | |
| Previous Owner | Elsbree Langdon | $111,100 |
Source: Public Records
Tax History Compared to Growth
Tax History
| Year | Tax Paid | Tax Assessment Tax Assessment Total Assessment is a certain percentage of the fair market value that is determined by local assessors to be the total taxable value of land and additions on the property. | Land | Improvement |
|---|---|---|---|---|
| 2025 | $5,481 | $424,782 | $107,360 | $317,422 |
| 2024 | $5,481 | $416,454 | $105,255 | $311,199 |
| 2023 | $5,365 | $408,290 | $103,192 | $305,098 |
| 2022 | $5,273 | $400,285 | $101,169 | $299,116 |
| 2021 | $5,180 | $392,437 | $99,186 | $293,251 |
| 2019 | $4,264 | $321,220 | $96,245 | $224,975 |
| 2018 | $4,129 | $314,922 | $94,358 | $220,564 |
| 2016 | $3,849 | $302,695 | $90,695 | $212,000 |
| 2015 | $3,794 | $298,149 | $89,333 | $208,816 |
| 2014 | $3,769 | $292,310 | $87,584 | $204,726 |
Source: Public Records
Map
Nearby Homes
- 464 W 8th St
- 555 W 9th St
- 584 W 9th St
- 425 W 10th St
- 470 W 11th St
- 357 W 10th St
- 1113 Yale Ave
- 540 W Baughman Ave
- 290 W 12th St
- 750 W 8th St
- 220 Babson Ct
- 207 Colby Cir
- 194 Principia Ct
- 1421 Rust Ct
- 630 W 1st St
- 1419 N Indian Hill Blvd
- 1458 N Mountain Ave
- 976 Butte St
- 944 Richmond Dr
- 960 E Bonita Ave
- 410 University Cir
- 475 W 8th St
- 403 University Cir
- 411 University Cir
- 420 University Cir
- 505 W 8th St
- 835 Berkeley Ave
- 467 W 8th St
- 421 University Cir
- 488 University Cir
- 480 University Cir
- 516 W 9th St
- 430 University Cir
- 525 W 8th St
- 439 W 8th St
- 470 University Cir
- 492 W 8th St
- 486 W 8th St
- 431 University Cir
- 478 W 8th St