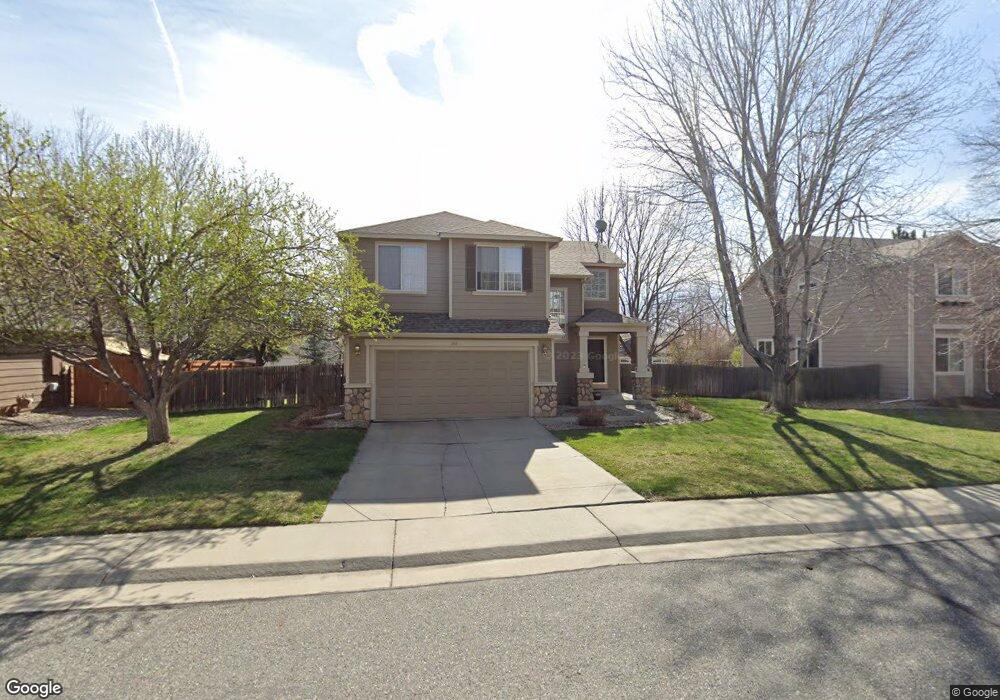
400 Vernier Ave Lafayette, CO 80026
Estimated Value: $672,000 - $756,000
3
Beds
3
Baths
1,312
Sq Ft
$544/Sq Ft
Est. Value
About This Home
This home is located at 400 Vernier Ave, Lafayette, CO 80026 and is currently estimated at $714,307, approximately $544 per square foot. 400 Vernier Ave is a home located in Boulder County with nearby schools including Lafayette Elementary School, Angevine Middle School, and Centaurus High School.
Ownership History
Date
Name
Owned For
Owner Type
Purchase Details
Closed on
Nov 14, 2015
Sold by
Arnold Catherine and Felse Brian
Bought by
Felse Catherine
Current Estimated Value
Purchase Details
Closed on
Aug 25, 2008
Sold by
Oneill James D
Bought by
Arnold Catherine
Home Financials for this Owner
Home Financials are based on the most recent Mortgage that was taken out on this home.
Original Mortgage
$186,000
Outstanding Balance
$122,346
Interest Rate
6.29%
Mortgage Type
Purchase Money Mortgage
Estimated Equity
$591,961
Purchase Details
Closed on
Dec 1, 1997
Sold by
Ju Siekmeier Luke James Wheeler Siekme
Bought by
Oneill James D
Home Financials for this Owner
Home Financials are based on the most recent Mortgage that was taken out on this home.
Original Mortgage
$153,900
Interest Rate
7.3%
Purchase Details
Closed on
Jan 26, 1996
Sold by
Kaufman & Broad Of Colorado Inc
Bought by
Siekmeier Luke James
Create a Home Valuation Report for This Property
The Home Valuation Report is an in-depth analysis detailing your home's value as well as a comparison with similar homes in the area
Home Values in the Area
Average Home Value in this Area
Purchase History
| Date | Buyer | Sale Price | Title Company |
|---|---|---|---|
| Felse Catherine | -- | None Available | |
| Arnold Catherine | $276,000 | Land Title | |
| Oneill James D | $162,000 | First American Heritage Titl | |
| Siekmeier Luke James | $142,101 | -- |
Source: Public Records
Mortgage History
| Date | Status | Borrower | Loan Amount |
|---|---|---|---|
| Open | Arnold Catherine | $186,000 | |
| Previous Owner | Oneill James D | $153,900 |
Source: Public Records
Tax History Compared to Growth
Tax History
| Year | Tax Paid | Tax Assessment Tax Assessment Total Assessment is a certain percentage of the fair market value that is determined by local assessors to be the total taxable value of land and additions on the property. | Land | Improvement |
|---|---|---|---|---|
| 2025 | $4,190 | $45,844 | $13,700 | $32,144 |
| 2024 | $4,190 | $45,844 | $13,700 | $32,144 |
| 2023 | $4,118 | $47,282 | $15,142 | $35,825 |
| 2022 | $3,582 | $38,134 | $11,356 | $26,778 |
| 2021 | $3,543 | $39,232 | $11,683 | $27,549 |
| 2020 | $3,225 | $35,285 | $10,153 | $25,132 |
| 2019 | $3,180 | $35,285 | $10,153 | $25,132 |
| 2018 | $2,640 | $28,915 | $11,160 | $17,755 |
| 2017 | $2,570 | $31,967 | $12,338 | $19,629 |
| 2016 | $2,687 | $29,269 | $10,268 | $19,001 |
| 2015 | $2,518 | $21,364 | $8,676 | $12,688 |
| 2014 | $1,930 | $21,364 | $8,676 | $12,688 |
Source: Public Records
Map
Nearby Homes
- 1140 Dorset Ct
- 718 Julian Cir
- 1125 Somerset St
- 725 Julian Cir
- 1160 Devonshire Ct
- 1140 Devonshire Ct
- 1376 Lambert Cir
- 925 Sparta Dr
- 880 Orion Dr
- 805 Argos Cir
- 490 E Sutton Cir
- 372 S Carr Ave
- 655 N Gooseberry Ct
- 200 S Carr Ave
- 911 Homer Cir
- 924 Milo Cir Unit A
- 561 Homestead St Unit 561
- 82 Goldhill Dr
- 736 Gateway Cir
- 998 Milo Cir Unit A
- 420 Vernier Ave
- 380 Vernier Ave
- 390 Mercator Ave Unit 111
- 405 Vernier Ave
- 370 Mercator Ave
- 385 Vernier Ave
- 440 Vernier Ave
- 410 Mercator Ave
- 425 Vernier Ave
- 350 Mercator Ave
- 365 Vernier Ave
- 345 Vernier Ave
- 445 Vernier Ave
- 330 Mercator Ave
- 405 London Ave
- 325 Vernier Ave
- 385 London Ave
- 425 London Ave
- 365 London Ave
- 305 Vernier Ave